My Reports allows you to consolidate data from multiple sources into a single, structured report. By integrating with various platforms, you can analyze key performance metrics from different tools without switching between dashboards.
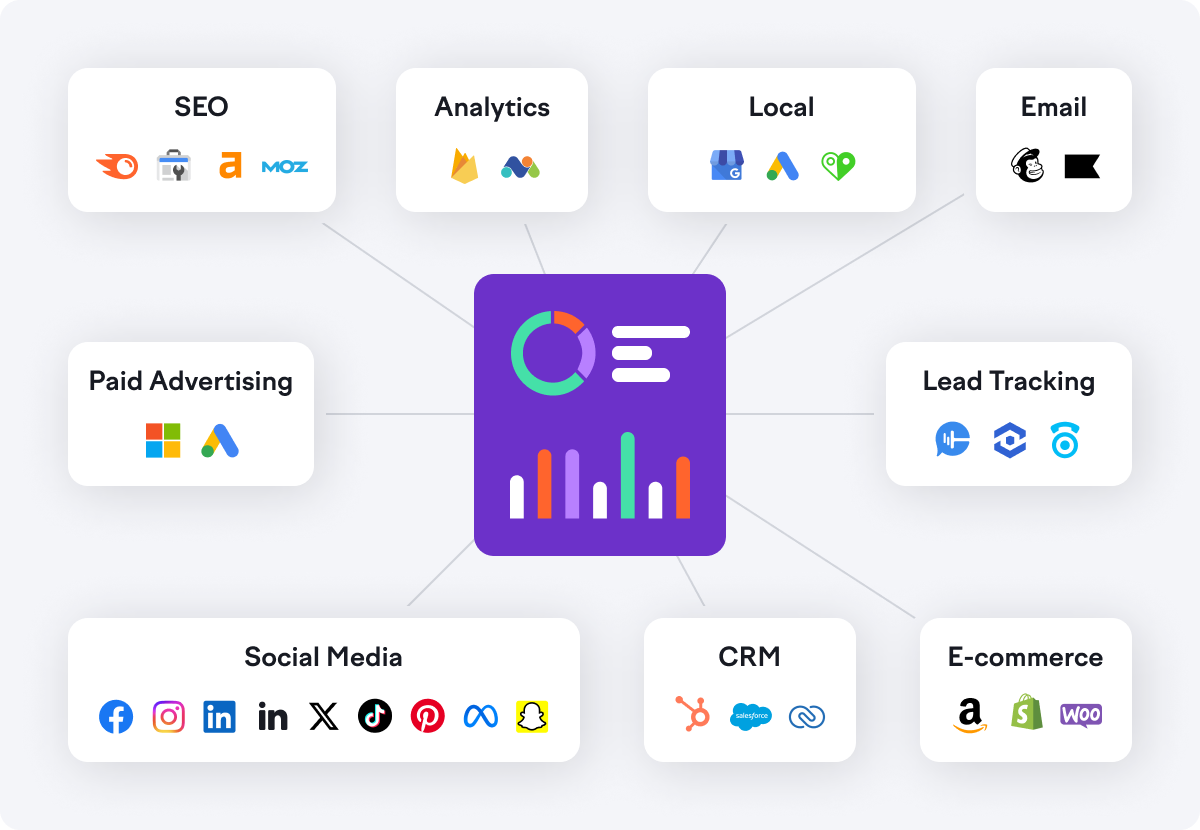
My Reports supports integrations with a wide range of platforms, allowing you to pull data from AI chat platforms, SEO, paid ads, analytics, social media, and more. Forget spreadsheets and copy-pasting—get clear, cross-channel insights in one place from sources like Semrush, Ahrefs, Moz, Yext, CallRail, Facebook Ads, Google Ads, HubSpot, LinkedIn Ads, Mailchimp, Matomo, Microsoft Ads, TikTok (Ads and Organic), and X (Twitter) Ads, among others.
Understanding how to connect and utilize these data sources can help you create more effective reports, track trends over time, and make informed decisions based on comprehensive insights. This guide will walk you through the available integrations and how to leverage them for better data analysis.
Semrush Integrations
You can integrate Semrush Analytics data from the following tools into your reports:
- Domain Overview: Get a high-level summary of a website’s organic and paid performance.
- Organic Research: Analyze keyword rankings, traffic trends, and competitor insights.
- Backlink Analytics: Explore a website’s backlink profile, including referring domains and link attributes.
- Advertising Research – Review paid search strategies, ad copies, and competitor PPC activity.
- PLA Research: Track product listing ads (PLAs) and compare competitors' performance in Google Shopping.
- Traffic Analytics: Gain insights into website traffic, user behavior, and engagement metrics.
- Keyword Overview: Evaluate keyword metrics, including search volume, difficulty, and CPC.
- Keyword Gap: Compare keyword profiles of multiple domains to identify ranking opportunities.
For Domain Overview, Organic Research, and Advertising Research, you can refine the data scope by selecting a domain, subdomain, subfolder, or specific URL within the report widgets. This flexibility allows you to generate more granular insights, compare subfolders within a site, or analyze different sections of competitors’ websites.

When setting up widgets in My Reports, simply choose the scope that aligns with your reporting needs. This enables you to tailor your analysis to specific site sections, refine comparisons, and consolidate data from various sources for a more detailed evaluation.

Please keep in mind that the data availability depends on your Toolkit subscription.
You can incorporate data from the following Project tools available in the SEO Toolkit into your reports:
- Site Audit: Access insights on website health, including an overview, issues report, crawled pages report, detailed issues, incoming internal links, canonicalization, and more.
- Position Tracking: Monitor keyword performance with widgets displaying visibility trends, a keyword rankings table, and rankings distribution.
- Backlink Audit: Include a summary of your audit, along with a bar graph distribution of referring domains by toxic score (toxic, potentially toxic, and non-toxic), anchor types, top anchors, and the ratio of follow vs. nofollow links.
- On Page SEO Checker: Add a list of optimization ideas generated for your site and visualize the trend of recommended improvements over time.
These integrations help you build comprehensive reports, combining multiple data points to track progress and make informed decisions.

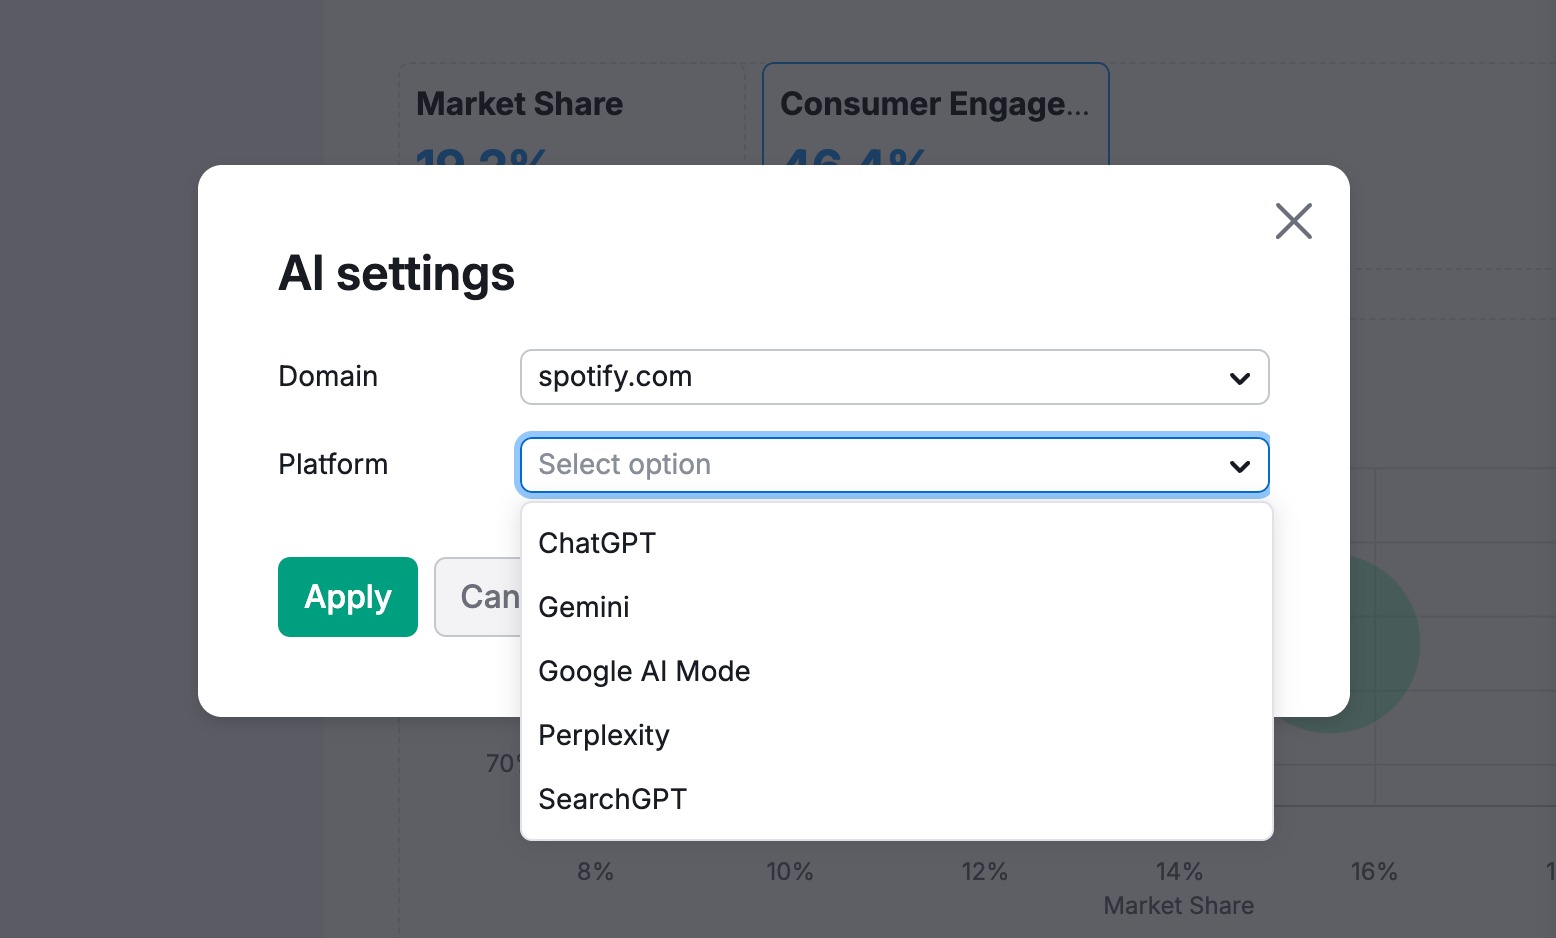
For AI SEO Toolkit data, you can choose an AI platform—such as ChatGPT, SearchGPT, Google AI Mode, Perplexity or Gemini—to gain insights into your brand presence across that platform. You can pull data on strategic insights, audience and content, business landscape, brand and marketing, as well as tailored recommendations.
Please keep in mind that this data is available with a Semrush AI SEO Toolkit subscription.
You can integrate data from the Semrush Local Toolkit into your reports using the following widgets:
-
Listing Management: Display key details about a business's online listings, including:
- Location list to provide an overview of all business locations.
- Listing status to show the accuracy of business information, including the percentage of data that is correct, unavailable, or still processing.
- Duplicate listing status and listing details widgets to give a comprehensive view of how business listings appear across directories.
-
Map Rank Tracker: Incorporate data from the Heatmap to visualize local search rankings across different geographic points.
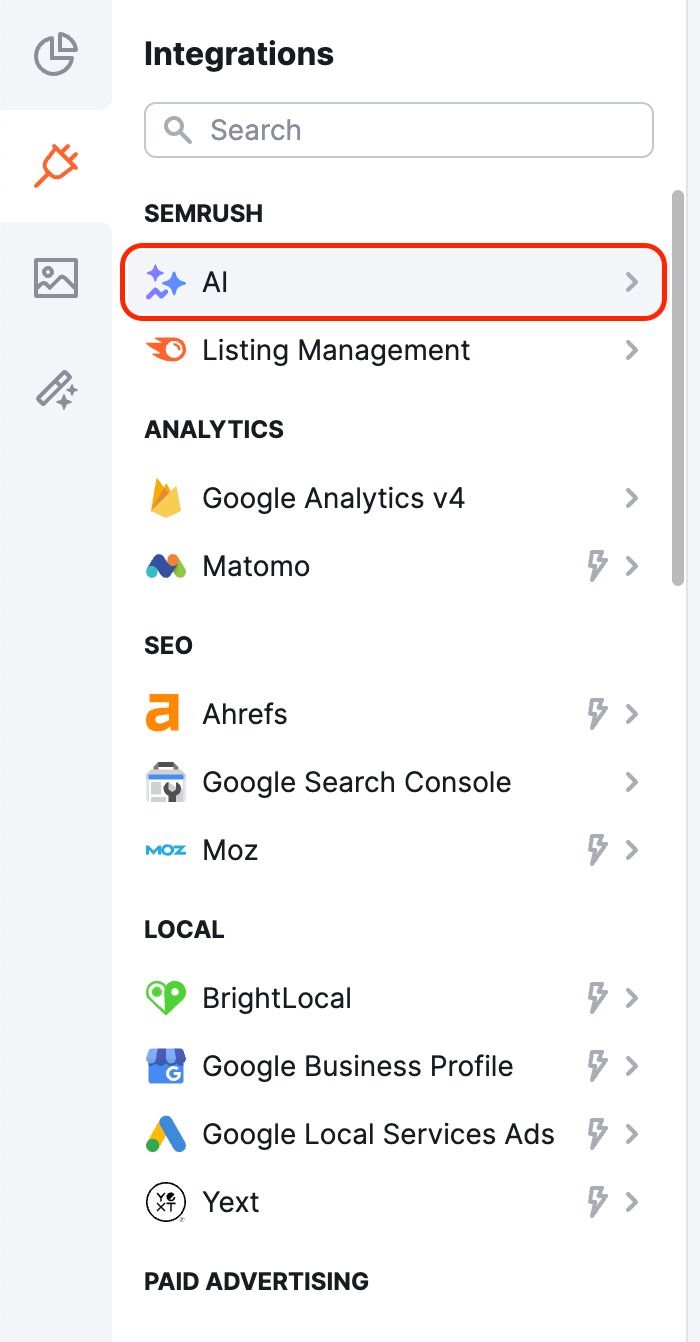
These widgets help businesses monitor their online presence, assess listing accuracy, and track local search visibility. You can find them in the Integrations tab under Listing Management.

External Integrations
My Reports supports data integration from various external platforms, allowing you to centralize key metrics within a single report. You can:
- Add single metrics for specific insights.
- Display data in different formats, including line and bar charts, tables, and donut views, for structured analysis.
- Combine multiple performance indicators from different platforms in one place.
By consolidating data from multiple sources, you can analyze results more efficiently without switching between dashboards. This helps in tracking trends, comparing performance across platforms, and gaining a clearer understanding of overall marketing and business performance.
Analytics
Integrating Google Analytics 4 (GA4) in My Reports provides a centralized view of website performance, user behavior, and conversions. It enables seamless analysis of traffic, engagement, and marketing impact alongside other key metrics, simplifying data-driven decision-making.
Additionally, you can isolate traffic from AI platforms like ChatGPT, Gemini, and Perplexity using the AI Referral filter, allowing you to measure the impact of AI on your site's performance.

Tracking AI Referral Traffic
With the AI Referral filter, you can measure how much traffic, revenue, and engagement your site receives from AI chat platforms. This helps you understand the growing impact of AI on your organic traffic, explain potential dips in traditional search traffic, and justify your AI-focused SEO and content strategies with data.
To filter your GA4 data for AI-driven traffic, follow these steps:
- Add any GA4 widget to your report (e.g., Sessions, Total Users, Key Events).
- Open the widget's settings.
- Select the Traffic Channel filter and choose AI Referral.
The widget will now display data exclusively from known AI sources.
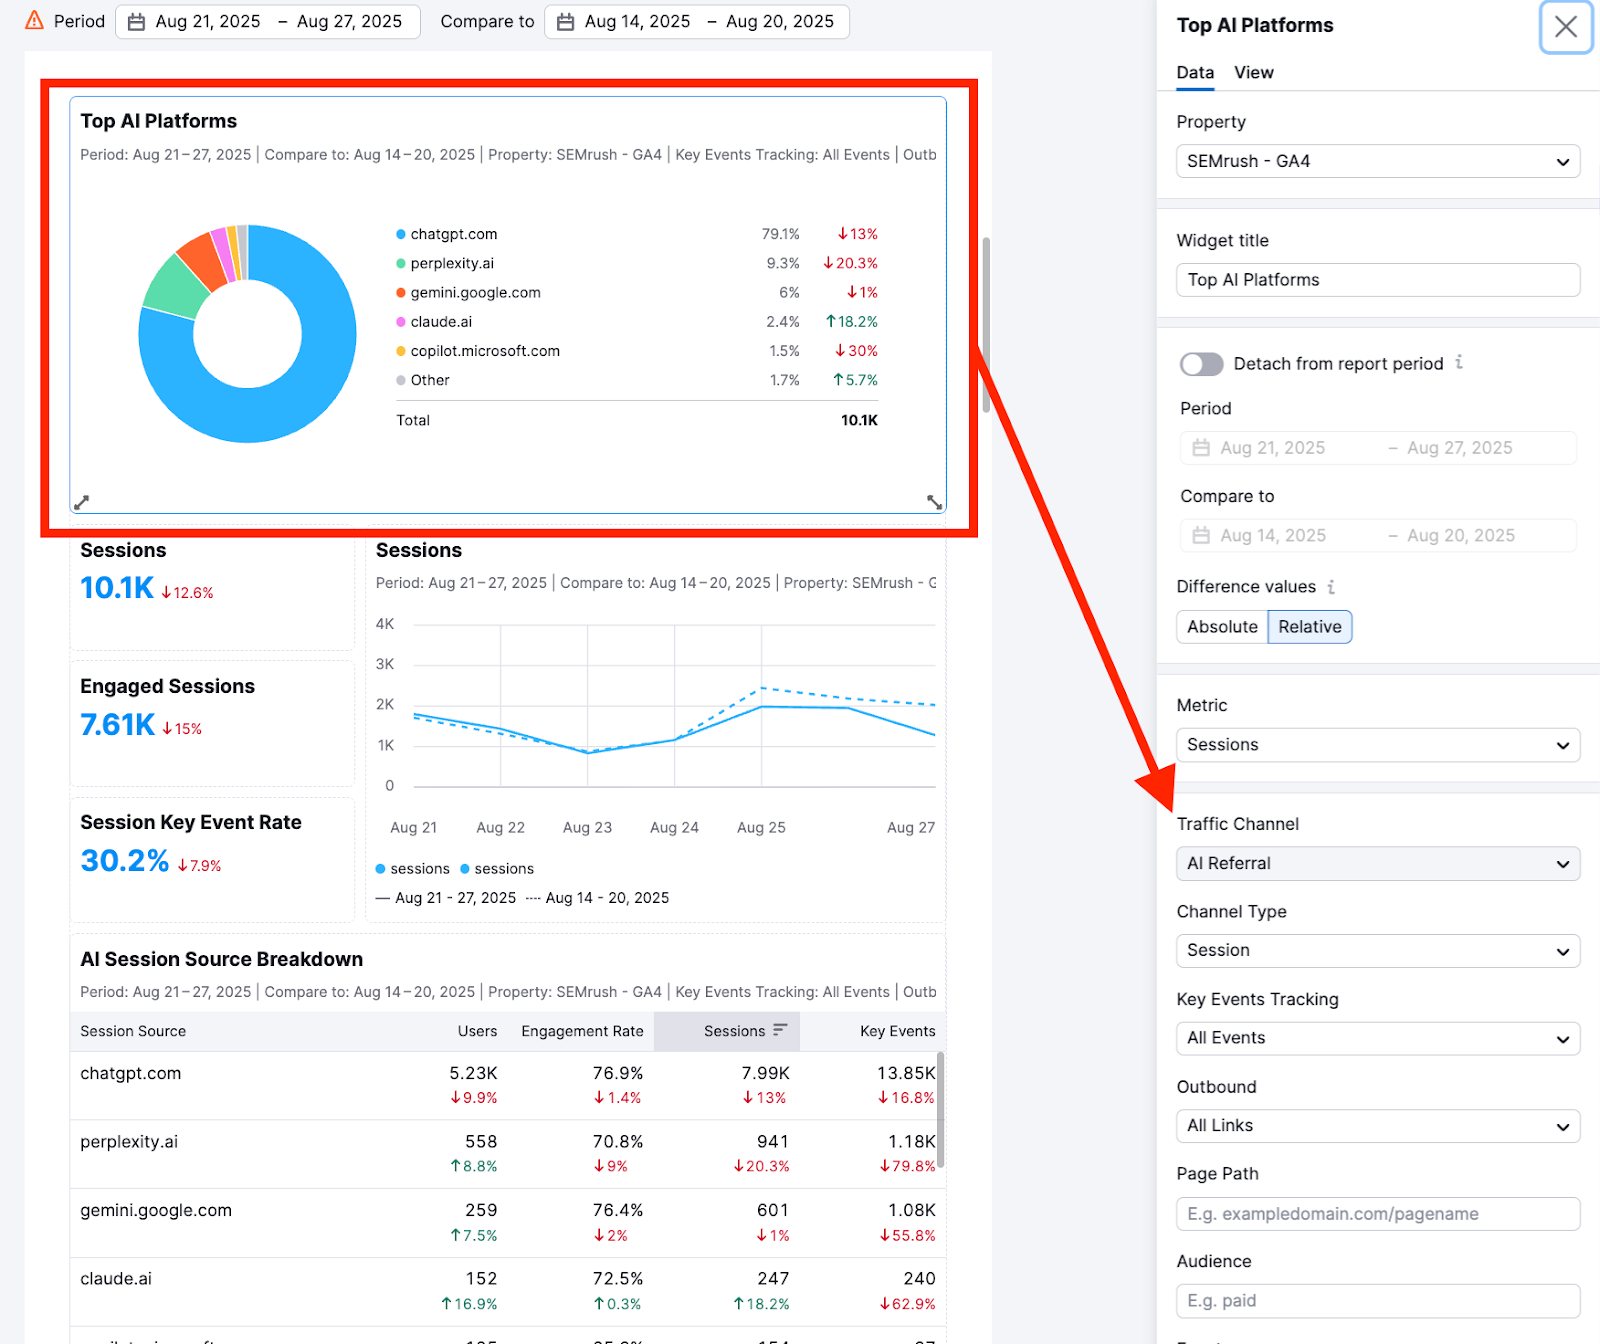
For a quick analysis, you can also add the pre-set AI Traffic Overview widget group, which covers the most common metrics for monitoring performance across AI channels.

Single metrics:
GOOGLE ANALYTICS CONVERSIONS
- Key Events
- New Users
- Sessions
- Total Users
- User Engagement
- Users
GOOGLE ANALYTICS PAGE
- ARPPU
- ARPU
- Average Purchase Revenue
- Engaged Sessions
- Event Count
- Event Count per User
- Events per Session
- Key Events
- New Users
- Purchase Revenue
- Sessions
- Sessions per User
- Total Revenue
- Total Users
- User Engagement
- Users
- Views
GOOGLE ANALYTICS EVENTS
- Event Count
- Event Count per User
- Event Value
- Events per Session
- Key Events
- New Users
- Sessions
- Total Revenue
- Total Users
- Transactions
- User Engagement
- Users
GOOGLE ANALYTICS TRAFFIC
- ARPPU
- Average Purchase Revenue
- Average Purchase Revenue per User
- Bounce Rate
- Engaged Sessions
- Event Count
- Events per Session
- First-Time Purchaser Rate
- First-Time Purchasers
- Gross Item Revenue
- Gross Purchase Revenue
- Item Refund Amount
- Item Revenue
- Items Purchased
- Items Viewed
- Key Events
- New Users
- Publisher Ad Clicks
- Publisher Ad Impressions
- Purchase Revenue
- Purchaser Rate
- Session Key Event Rate
- Sessions
- Sessions per User
- Shipping Amount
- Tax Amount
- Total Ad Revenue
- Total Purchasers
- Total Revenue
- Total Users
- Transactions
- User Engagement
- Users
- Views
Metrics in Table:
GOOGLE ANALYTICS CONVERSIONS
- Campaign
- Source / Medium
- GOOGLE ANALYTICS PAGE
- Page Path
- Page Path and Screen Class
- Page Title and Screen Class
- Page Title and Screen Name
- Source / Medium
GOOGLE ANALYTICS EVENTS
- Event Name
- Link URL
- Source / Medium
GOOGLE ANALYTICS TRAFFIC
- Age
- Browser
- Campaign
- City
- Country
- Default Channel Group
- Device
- Device Brand
- Device Category
- Gender
- Interests
- Item Name
- Language
- Medium
- Mobile Model
- Operating System
- Operating System with Version
- OS Version
- Page Path
- Region
- Session Source
- Session Source / Medium
- Session Source Platform
- Source / Medium
Metrics in groups:
- AI Traffic Overview
- Audience Insights
- Key Events, Overview
- E-Commerce Overview
- Top Traffic Channels
- Top Pageviews
Integrating Matomo in My Reports allows you to track website performance, user behavior, and engagement metrics in one place. This integration provides deep insights into unique visitors and site technology performance, helping you better understand your audience and their experience. With access to up to five years of historical data, you can analyze long-term trends in traffic and conversions while maintaining data privacy, offering a comprehensive view of your digital performance.

Single metrics:
OVERVIEW
- Actions
- Actions Per Visit
- Average Pageload Time
- Average Visit Duration
- Bounce Rate
- Conversion Rate
- Conversions
- Revenue
- Visits
E-COMMERCE
- Average Order Value
- Ecommerce Conversion Rate
- Ecommerce Orders
- Ecommerce Revenue
- Purchased Products
Metrics in Table:
OVERVIEW
- Browser
- Campaign Name
- Channel Types
- City
- Country
- Device Type
- Goal Name
- Keywords
- Language
- Operating System
- Region
- Search Engines
- Social Networks
E-COMMERCE
- Product Category
- Product Name
PAGES
- Entry Pages
- Exit Pages
- Page Title
- Page URL
SEO
With access to Ahrefs API, you can pull the following metrics from Ahrefs:
Single metrics:
AHREFS KEYWORD HISTORY
- Top 11+
- Top 3
- Top 4-10
AHREFS METRICS
- Organic Traffic
- Organic Traffic Value
- Paid Pages
- Paid Traffic
- Paid Traffic Cost
Metrics in Table:
AHREFS KEYWORD HISTORY
- Date
AHREFS METRICS BY COUNTRY
- Country
- Date
AHREFS METRICS
- Date
AHREFS TOP PAGES
- Date
- Top Keywords
- Top Pages
Integrating Google Search Console in My Reports provides insights into search performance, keyword rankings, and site visibility. It helps track impressions, clicks, and indexing status, allowing for a clearer understanding of organic search performance.
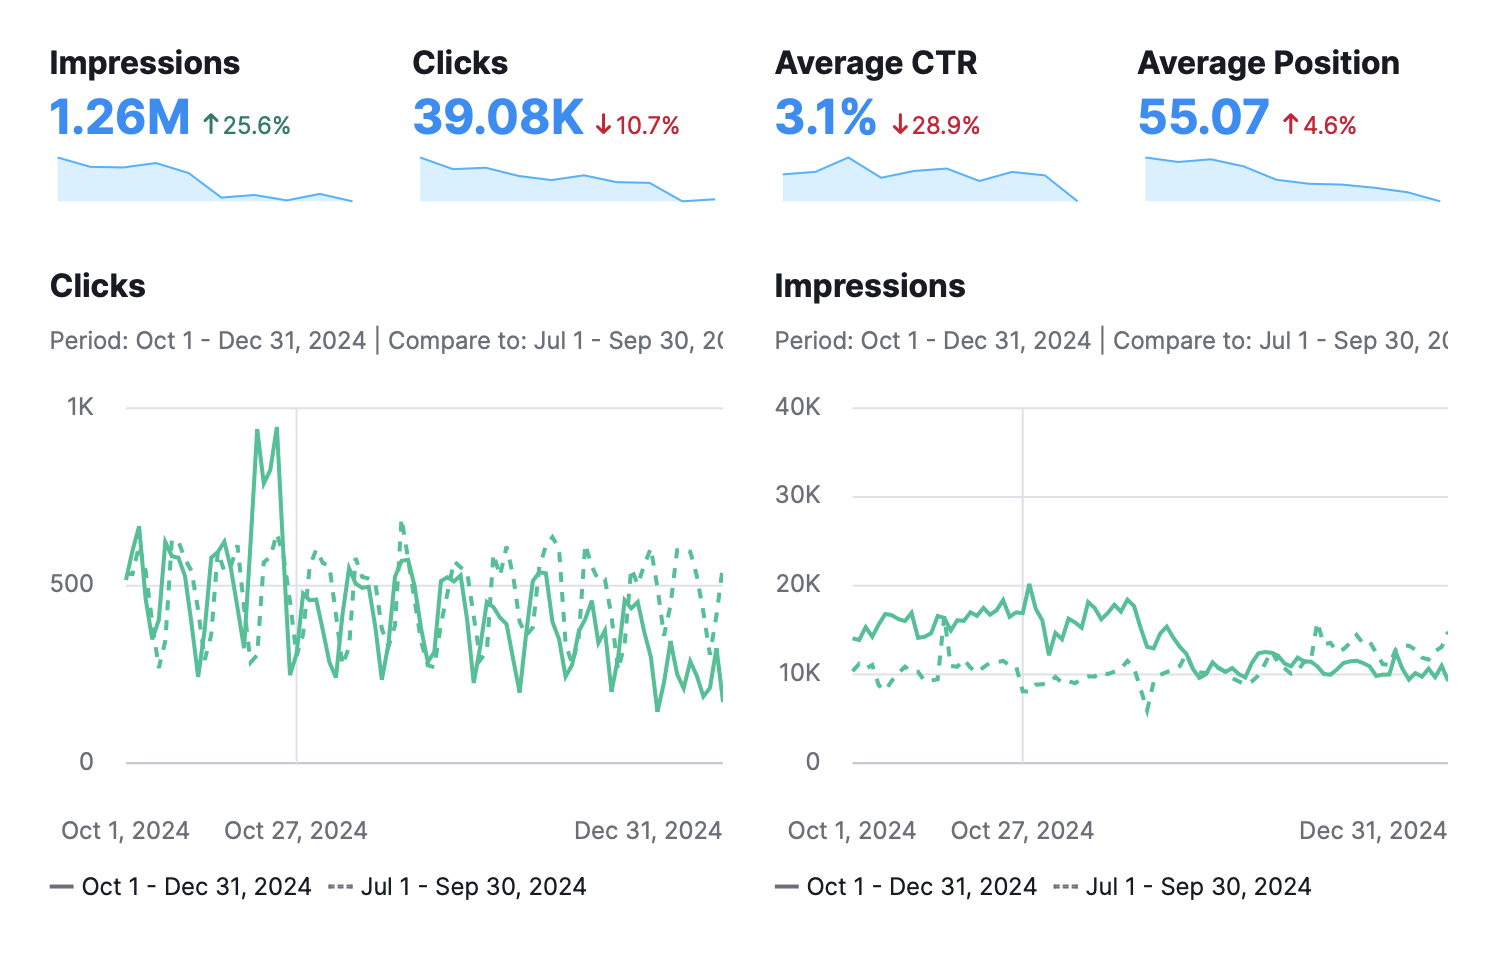
Single metrics:
SEARCH RESULTS
- Average CTR
- Average Position
- Clicks
- Impressions
Metrics in Table:
SEARCH RESULTS
- Country
- Device
- Page
- Query
- Search Appearance
Metrics in groups:
- Search Performance Overview
- Audience Insights
- Desktop Search
- Mobile Search
With access to Moz API, you can pull the following metrics from Moz:

Single metrics:
- Backlinks to Domain
- Backlinks to Page
- Backlinks to Subdomain
- Domain Authority
- Domains Linking to Domain
- Domains Linking to Page
- Domains Linking to Subdomain
- Page Authority
Metrics in Table:
- Date
- Page
- Root Domain
- Subdomain
Local
Integrating BrightLocal in My Reports provides insights into local SEO performance, citation tracking, and online reputation. It helps monitor rankings, reviews, and listing accuracy, allowing for better management of local search visibility and business presence.

Single metrics:
- New Reviews
Metrics in Table:
- Review
- Review Title
- Source
Note: You need access to the Review Management feature in BrightLocal to pull review data.
Integrating Google Business Profile (GBP) in My Reports allows you to track local search performance, customer interactions, and engagement metrics. It helps monitor visibility, reviews, and user actions, providing insights into how customers find and interact with your business.

Single metrics:
PERFORMANCE
- Bookings
- Call Clicks
- Direction Requests
- Food Orders
- Impressions
- Impressions Desktop Maps
- Impressions Desktop Search
- Impressions Mobile Maps
- Impressions Mobile Search
- Interactions
- Menu Clicks
- Website Clicks
REVIEWS
- Average Rating
- Total Reviews
Metrics in Table:
PERFORMANCE
- Device
- Impression Type
- Platform
REVIEWS
- Rating
- Review
Integrating Google Local Services Ads in My Reports allows you to track ad performance, lead volume, and budget insights. It helps measure visibility, customer interactions, and conversion effectiveness, providing a clear view of your local advertising impact.

Single metrics:
- Bookings
- Charged Leads
- Leads
- Messages
- Phone Calls
Metrics in Table:
- Category
- Lead Status
- Lead Type
- Service
Integrating Yext in My Reports provides insights into your local listings' performance and online reputation. This integration helps you monitor listing accuracy, track reviews, and measure customer engagement across multiple locations, allowing for better management of your brand's digital presence.
Single metrics:
TOTAL
- Active Listings Live
- Facebook Page Views
- Page Views
- Profile Views
- Reviews
- Searches
- Total Listings Actions
- Total Listings Impressions
REVIEWS
- Rating
- Reviews
LISTINGS
- Active Listings Live
- Google Listings Actions
- Google Listings Impressions
- New Listings Live
- Post Count
- Profile Views
- Searches
- Total Listings Actions
- Total Listings Impressions
- Yelp Page Views
Metrics in Table:
TOTAL
- Date
REVIEWS
- Review ID
- Review Title
- Review Type
- Status
LISTINGS
- Date
- Site
Paid Advertising
Integrating Google Ads in My Reports provides a clear view of campaign performance, ad spend, and key metrics like clicks, impressions, and conversions. This helps track advertising effectiveness and optimize budget allocation based on data-driven insights.
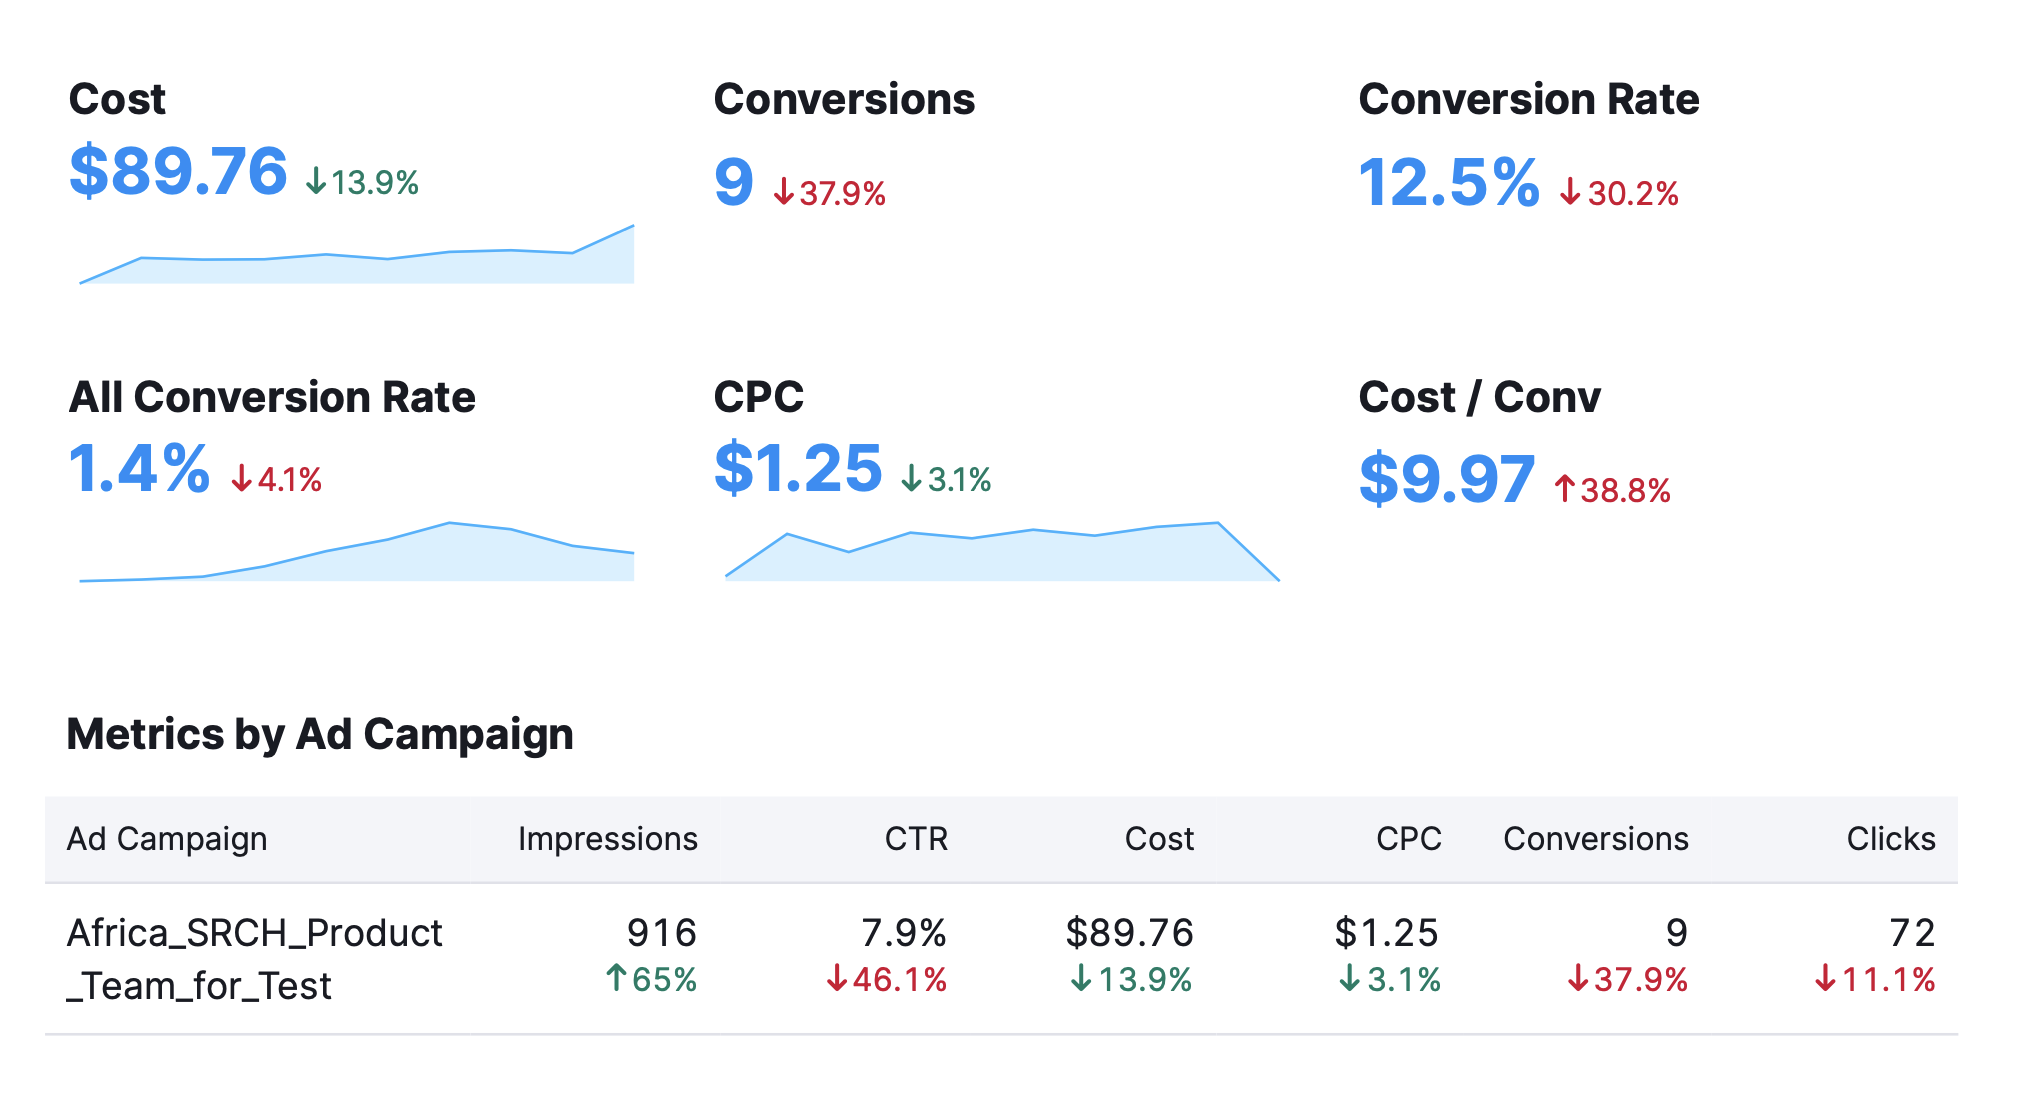
Single metrics:
- % New Sessions
- Abs Top Impression Share
- All Conversion Rate
- All Conversions
- All Conversions Value
- Average CPM
- Clicks
- Conversion Rate
- Conversion Value
- Conversions
- Cost
- Cost / All Conv
- Cost / Conv
- CPC
- CPE
- CPV
- CTR
- Engagement Rate
- Engagements
- Gmail Clicks To Website
- Gmail Forwards
- Gmail Saves
- Impressions
- Interaction Rate
- Interactions
- Phone Calls
- Phone Impressions
- Phone Through Rate
- Search Impression Share
- Video Views
- View-Through Conversions
- Viewable CPM
Metrics in Table:
- Ad Campaign
- Destination Type
- Device
- Network
- Ad Campaign
- Ad Group
- Destination Type
- Device
- Network
- Ad
- Ad Campaign
- Ad Group
- Ad URL
- Destination Type
- Device
- Keyword
- Network
- Age
- Placement
- Placement Type
- Gender
- Landing Page
- City
- Country
- Region
- Search Term
Integrating Microsoft Ads in My Reports provides a comprehensive view of your advertising performance across the Microsoft Search Network. You can track key metrics such as impressions, clicks, conversions, and ad spend, helping you assess campaign effectiveness.
By analyzing these insights alongside other marketing data, you can optimize ad strategies, improve ROI, and make data-driven decisions to enhance your paid search efforts.
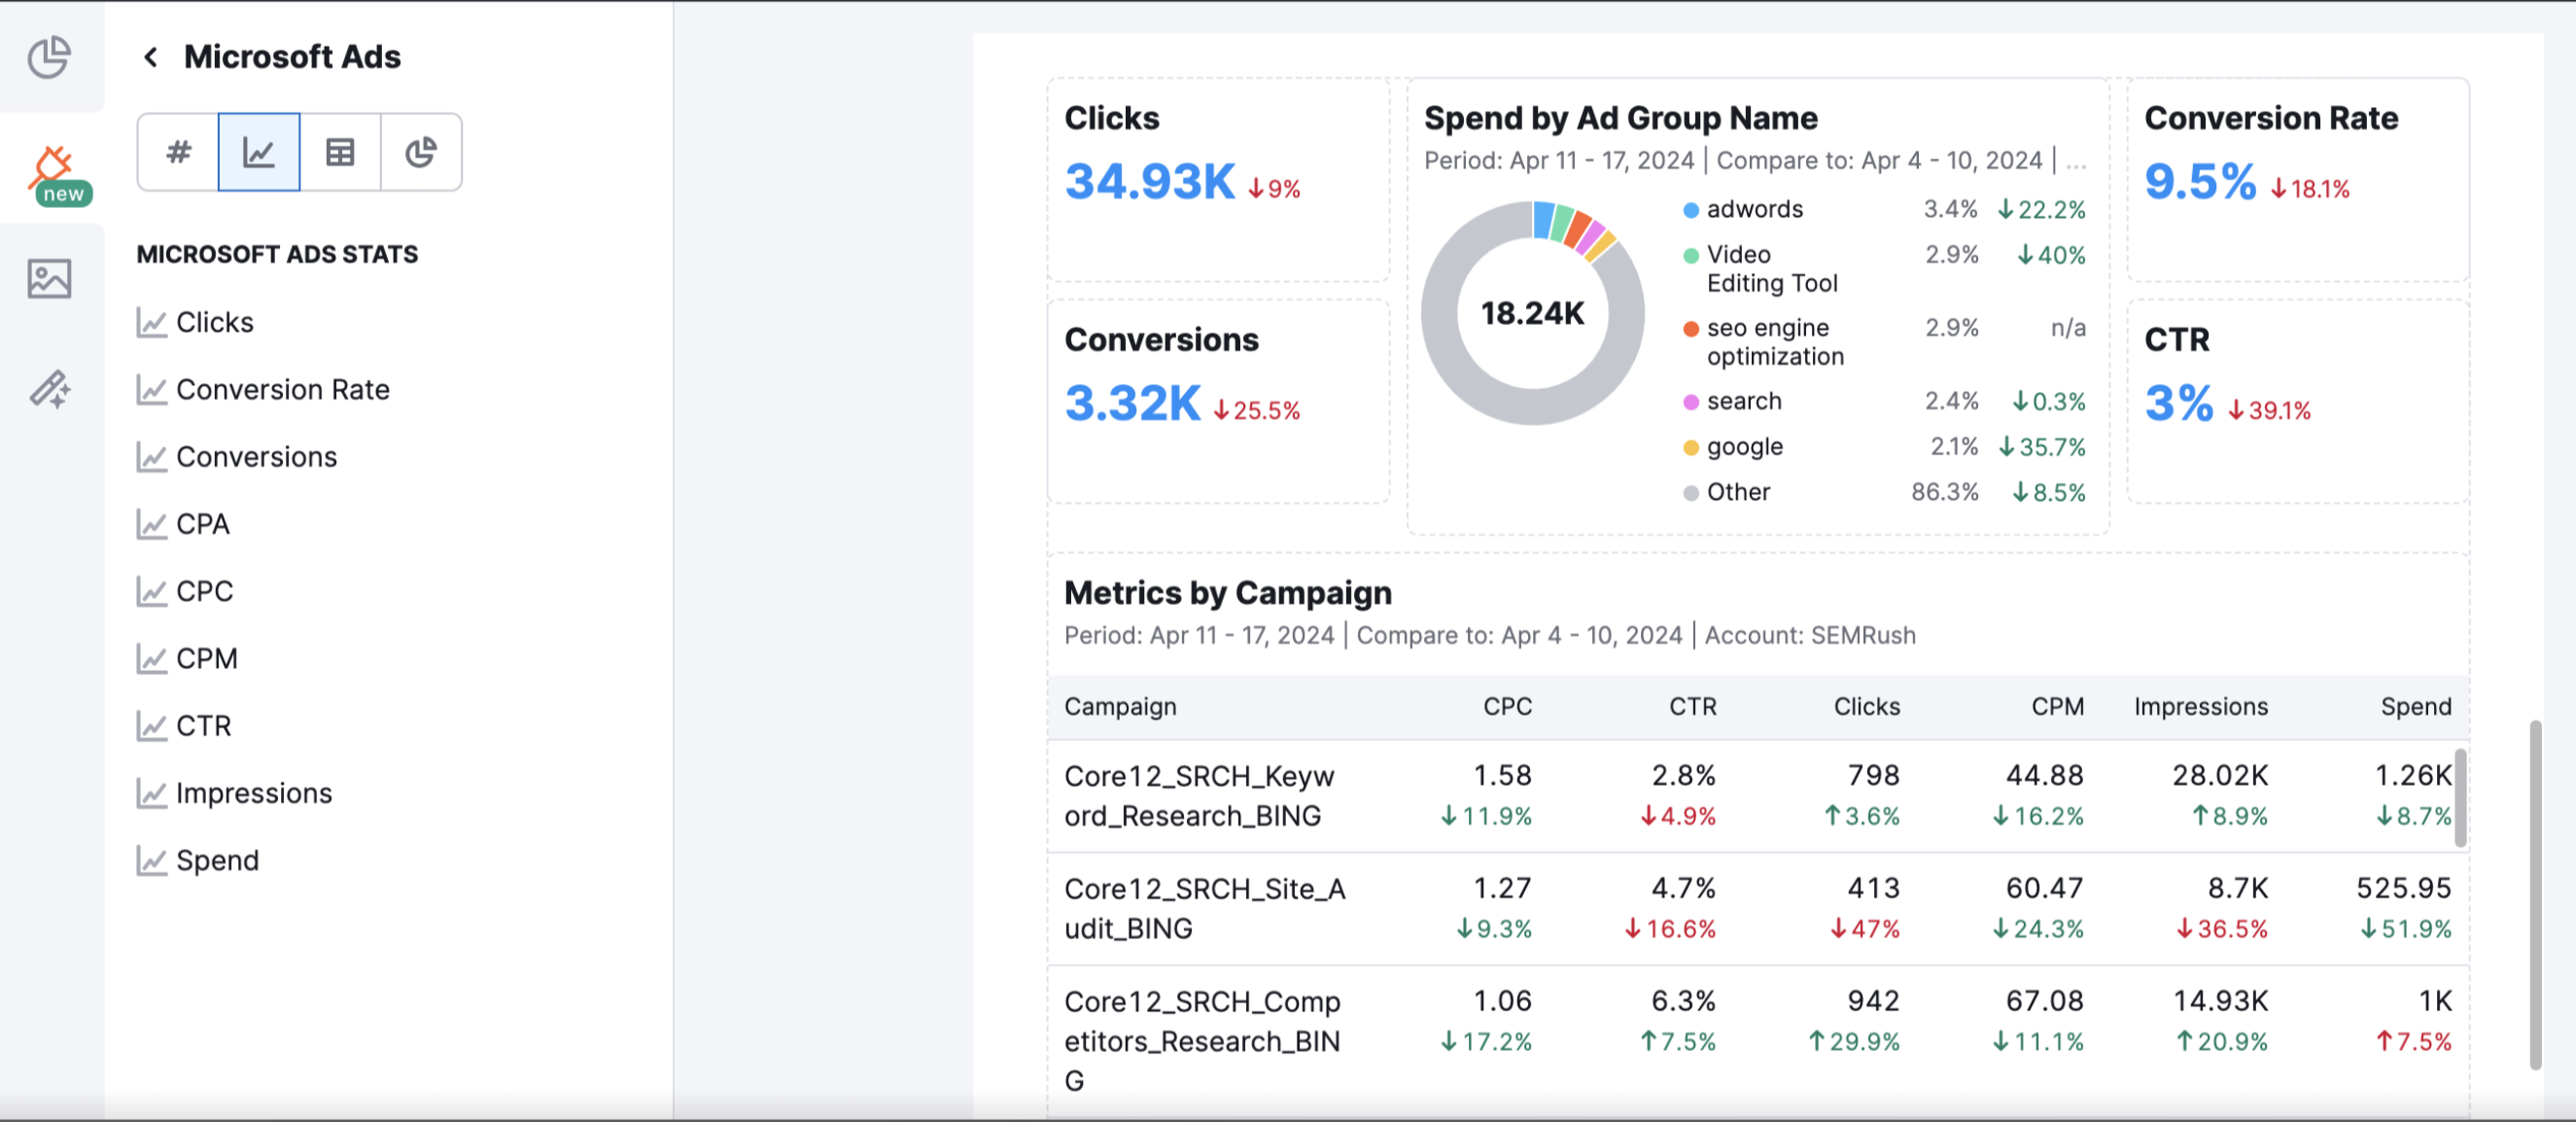
Single metrics:
- Clicks
- Conversion Rate
- Conversions
- CPA
- CPC
- CPM
- CTR
- Impressions
- Spend
Metrics in Table:
- Ad Group ID
- Ad Group Name
- Ad ID
- Ad Network
- Ad Type
- Campaign
- Campaign ID
- Date
- Keyword
- Keyword ID
Lead Tracking
Integrating CallRail in My Reports allows you to track call tracking metrics, lead attribution, and customer interactions in one place. It helps analyze call performance alongside other marketing data, providing insights to optimize campaigns and improve ROI.

What you can track
Calls:
- Answer Rate
- Answered Calls
- Average Duration
- First Time Callers
- Inbound Calls
- Miss Rate
- Missed Calls
- Outbound Calls
- Qualified Calls
- Qualified Leads
- Total Calls
Forms:
- First Time Submissions
- Form Leads
- Submissions
How to get started:
- Go to the integrations section in My Reports.
- Select CallRail and click "Connect."

- Follow the prompts to log in and authorize the integration.
- Customize your reporting dashboards to include CallRail data.
Whether you're monitoring leads or optimizing campaigns, CallRail integration ensures you have all the data you need at your fingertips. Start using CallRail in My Reports today and make your reporting smarter and more efficient.
Integrating CallTrackingMetrics in My Reports provides a detailed view of call tracking, conversation analytics, and lead attribution. By combining this data with other marketing metrics, you can better understand customer interactions, measure campaign effectiveness, and refine your marketing strategies for improved ROI.
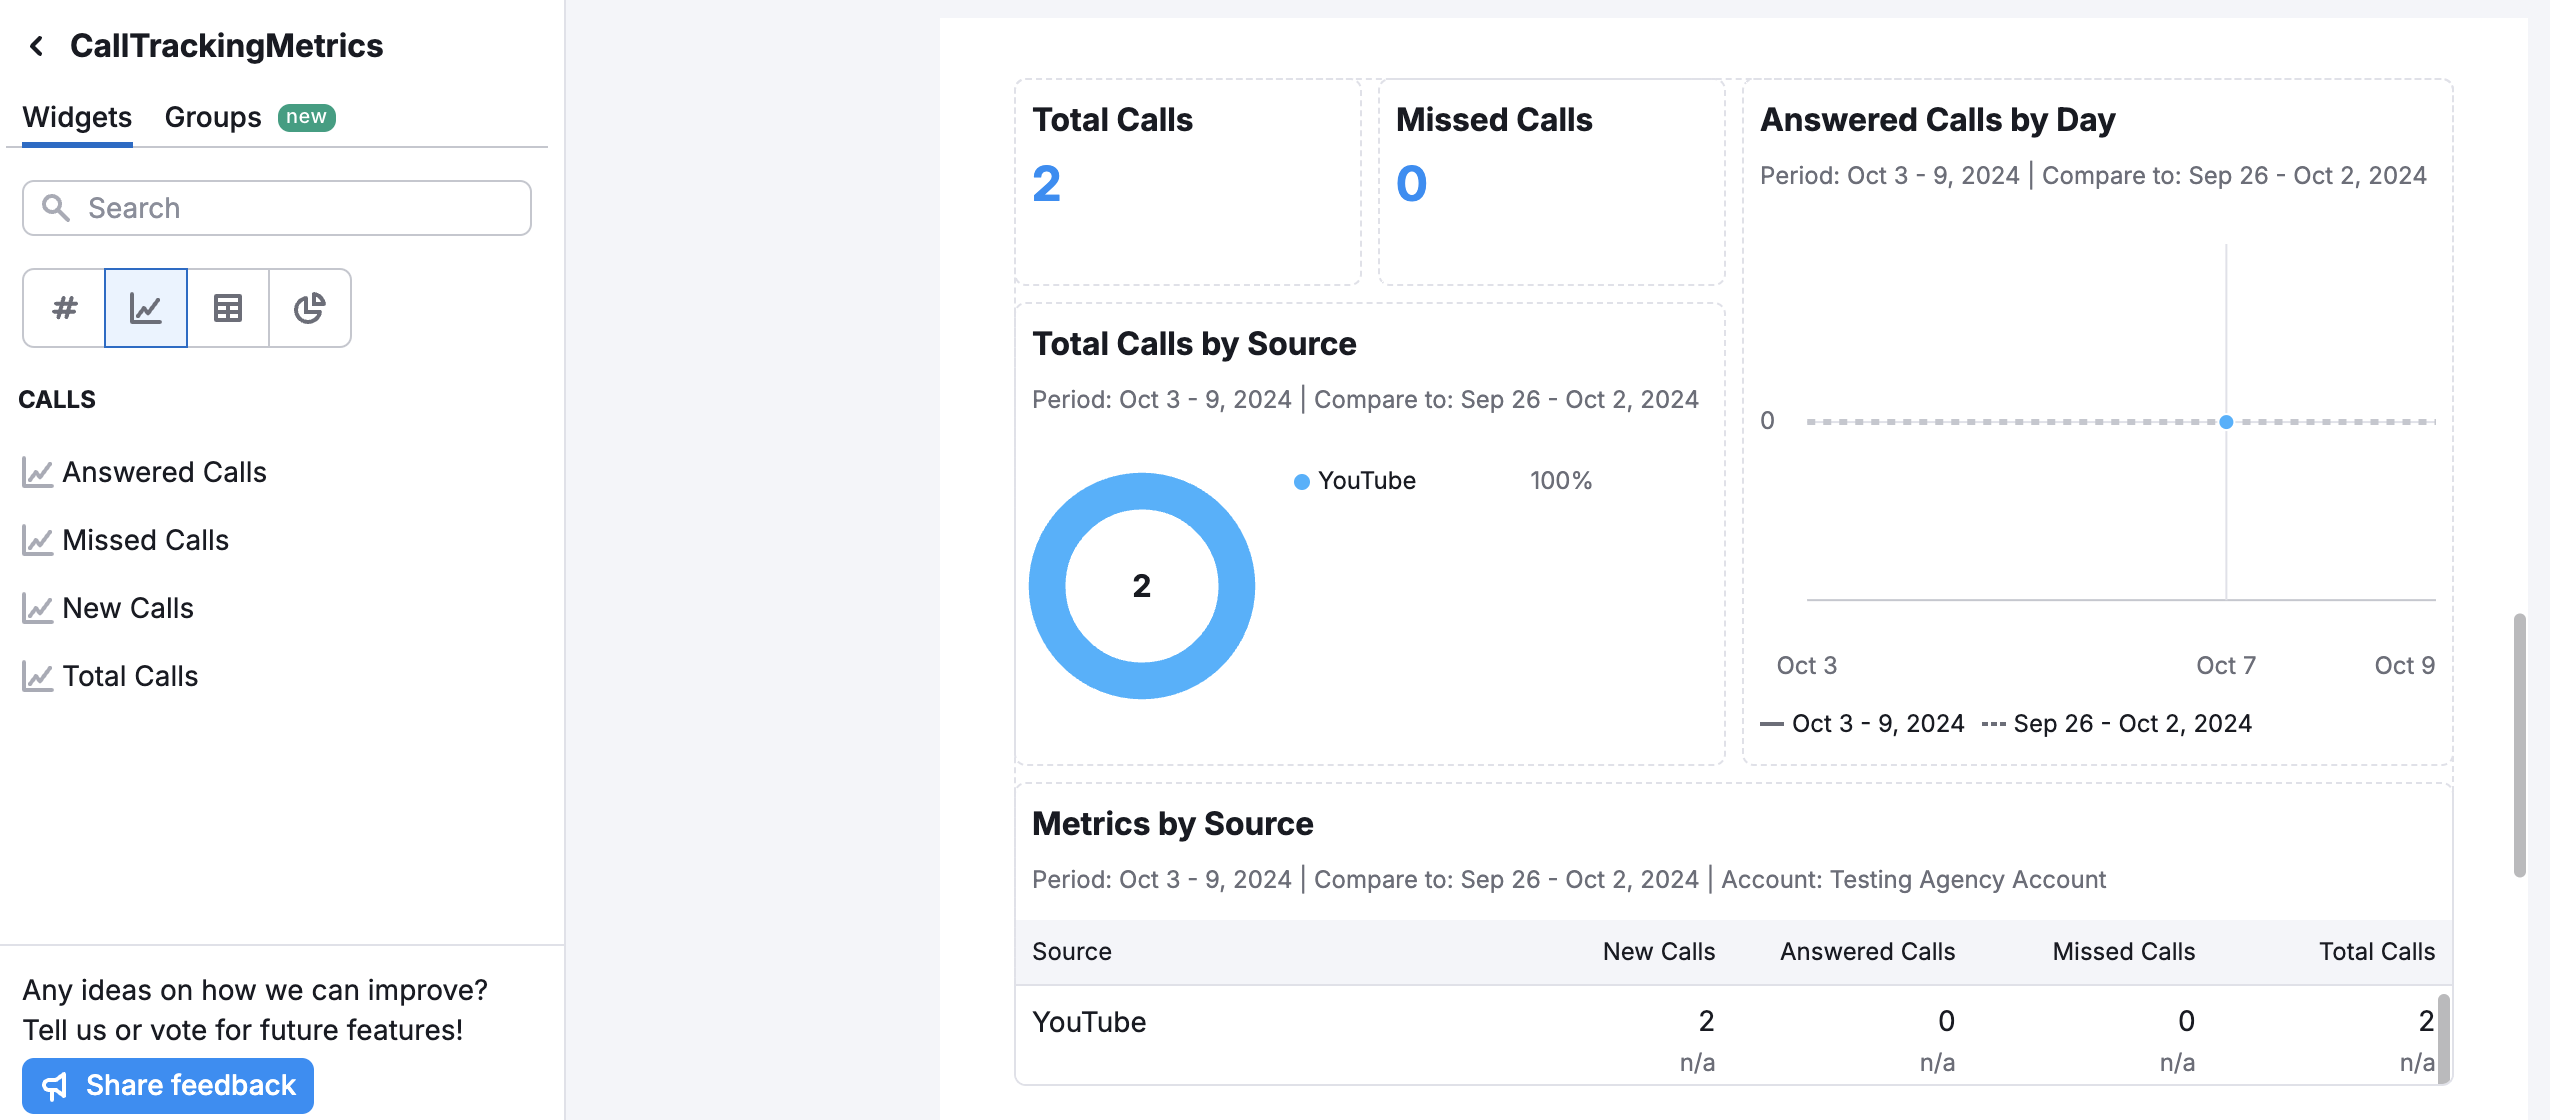
Single metrics:
CALLS
- Answered Calls
- Missed Calls
- New Calls
- Total Calls
Metrics in Table:
CALLS
- Date
- Source
Integrating WhatConverts in My Reports allows you to track leads from calls, forms, and chats in one place. It provides insights into lead sources, customer interactions, and conversion performance, helping you measure marketing effectiveness and optimize campaigns for better results.
Single metrics:
- Chats
- Emails
- Events
- Lead Score
- Not Quotable Leads
- Pending Leads
- Phone Calls
- Quotable Leads
- Quote Value
- Sales Value
- Text Messages
- Total Leads
- Transactions
- Web Form
Metrics in Table:
- Account ID
- Lead Campaign
- Lead Content
- Lead ID
- Lead Keyword
- Lead Medium
- Lead Source
- Lead State
- Lead Status
- Lead Type
- Profile
- Profile ID
- Quotable
- Spotted Keywords
Social Media
Integrating Facebook Pages in My Reports allows brands to monitor audience growth, engagement, and content performance in one place. It helps track reach, interactions, and post effectiveness, providing valuable insights to optimize social media strategy and strengthen brand presence.
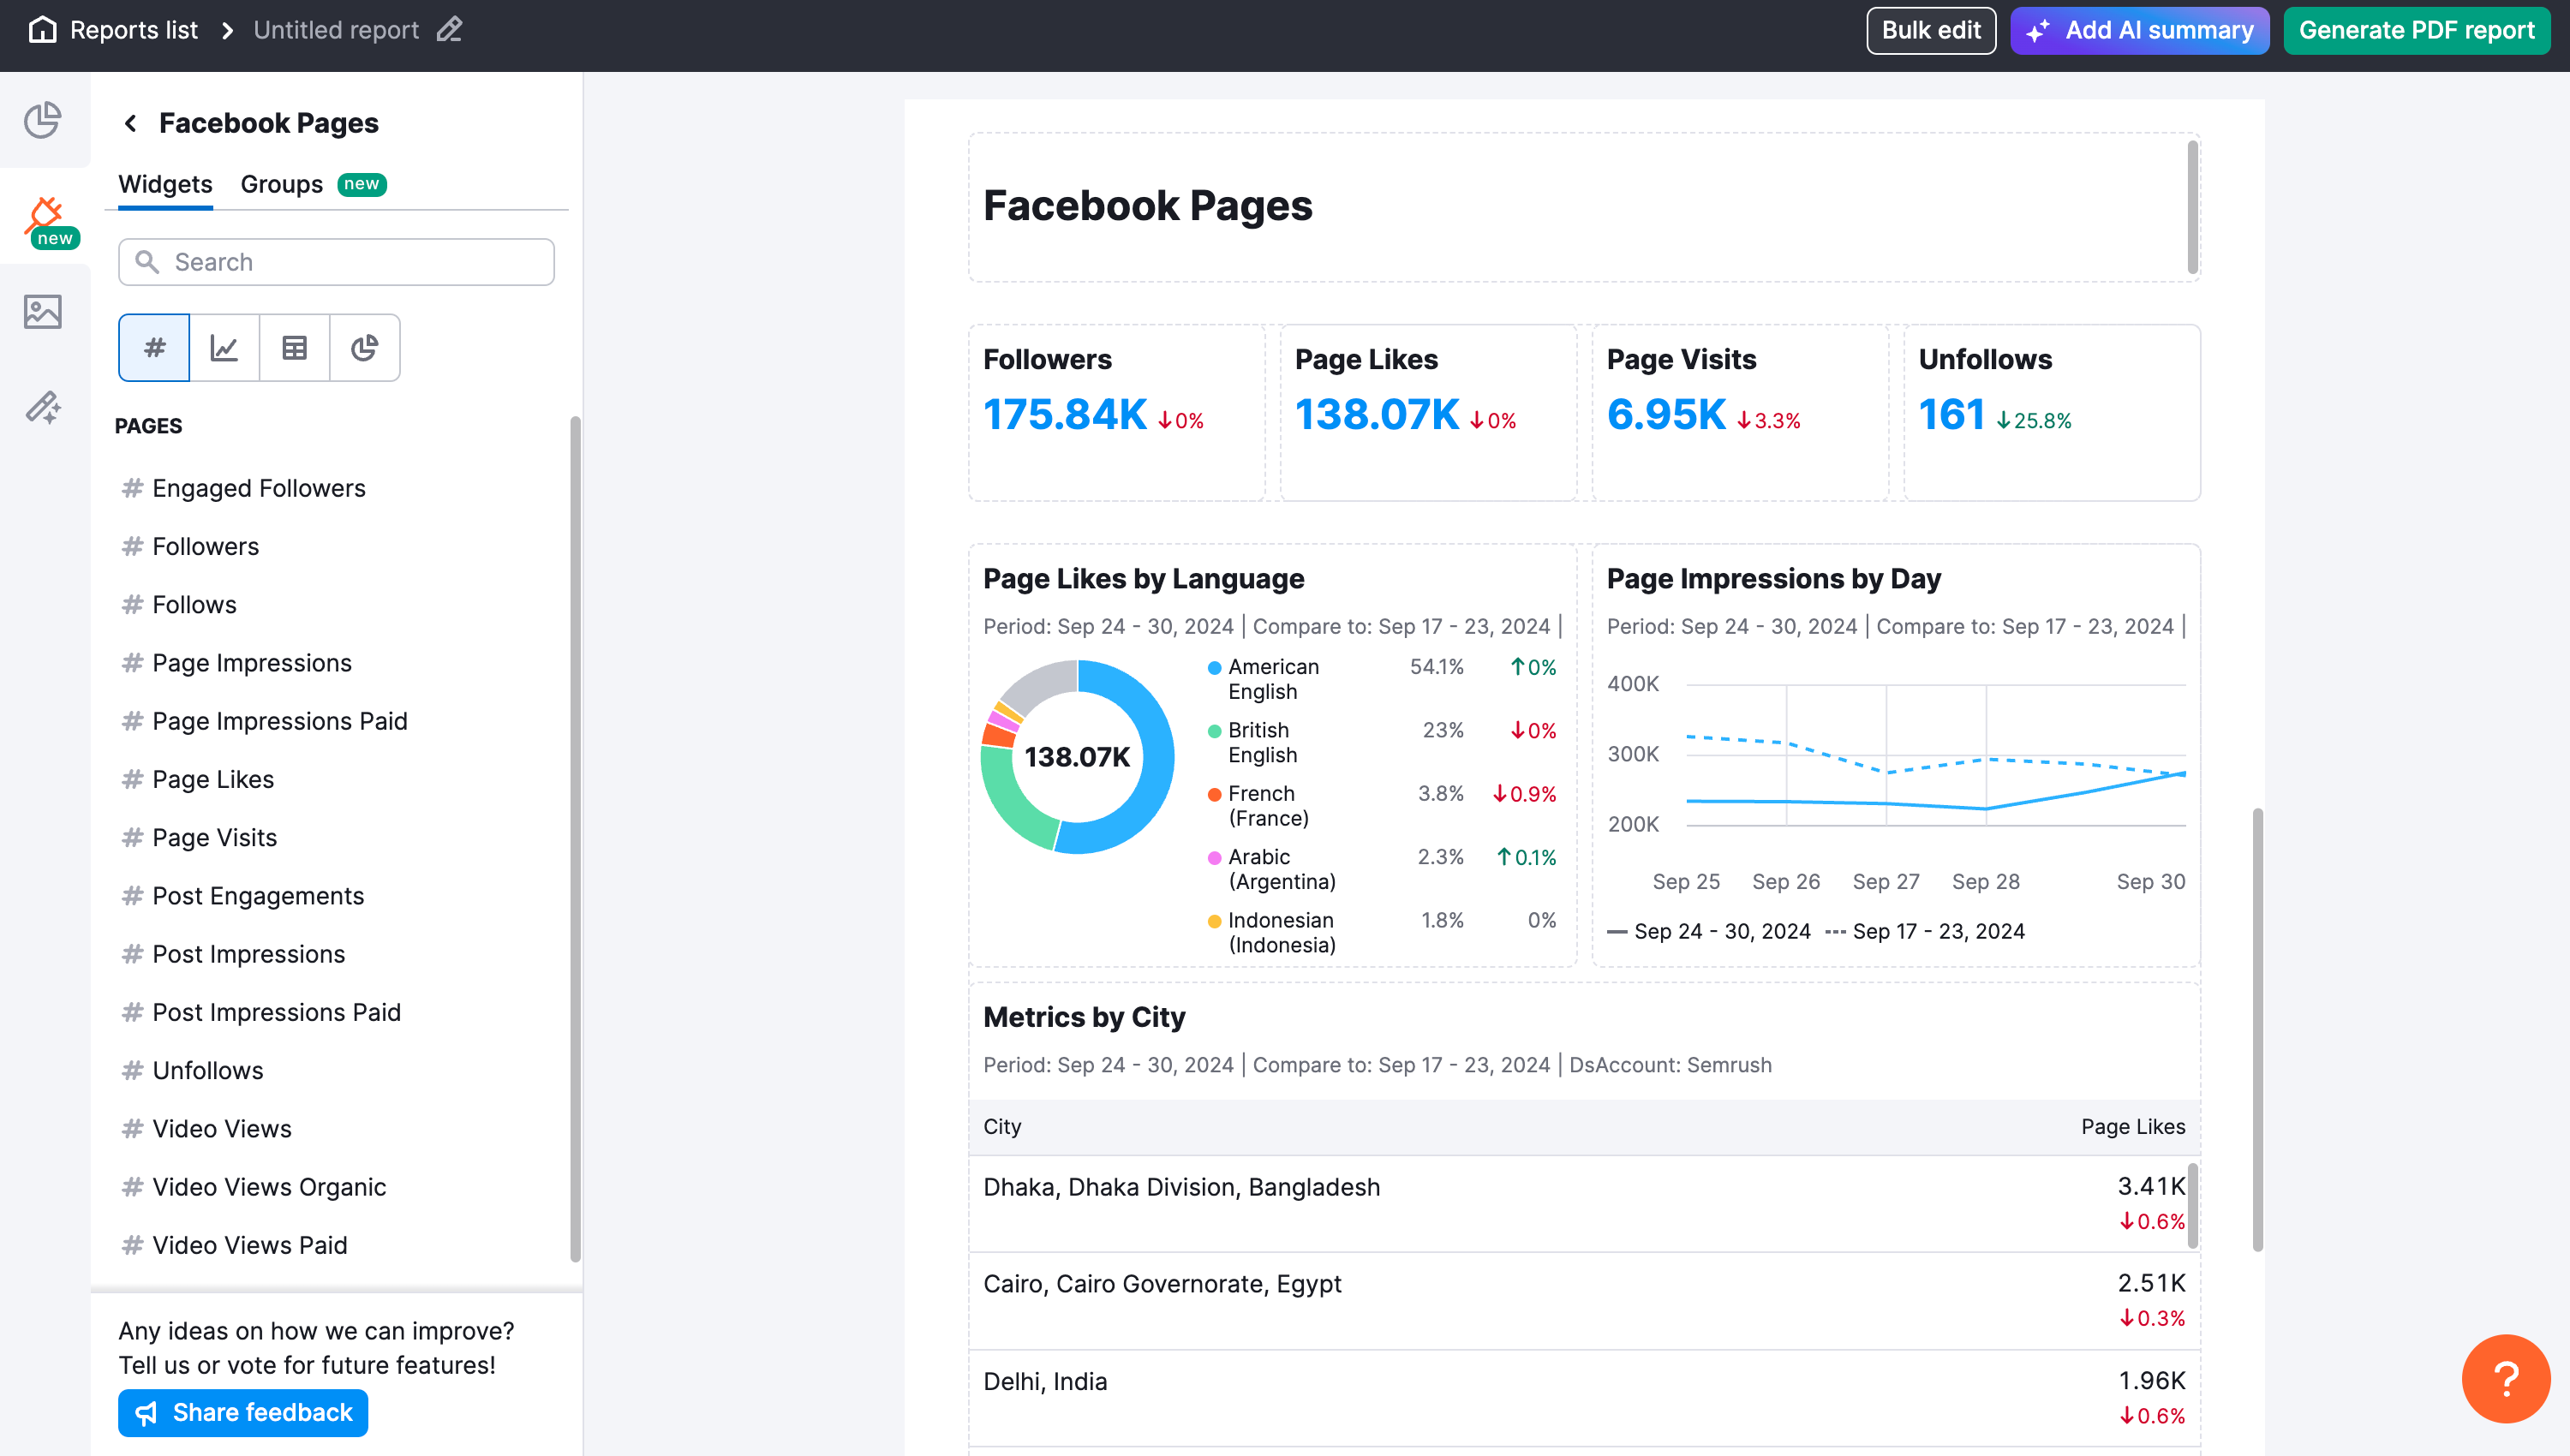
Single metrics:
- Engaged Followers
- Followers
- Follows
- Page Impressions
- Page Impressions Paid
- Page Likes
- Page Visits
- Post Engagements
- Post Impressions
- Post Impressions Paid
- Unfollows
- Video Views
- Video Views Organic
- Video Views Paid
Metrics in Table:
PAGES
- City
- Country
- Language
POSTS
- Posts
Metrics in groups:
- Page Overview
- Audience Insights
- Posts
Integrating Instagram Organic in My Reports allows brands to track audience growth, engagement, and content performance in one place. It provides insights into reach, interactions, and post effectiveness, helping refine social media strategy and enhance brand visibility.
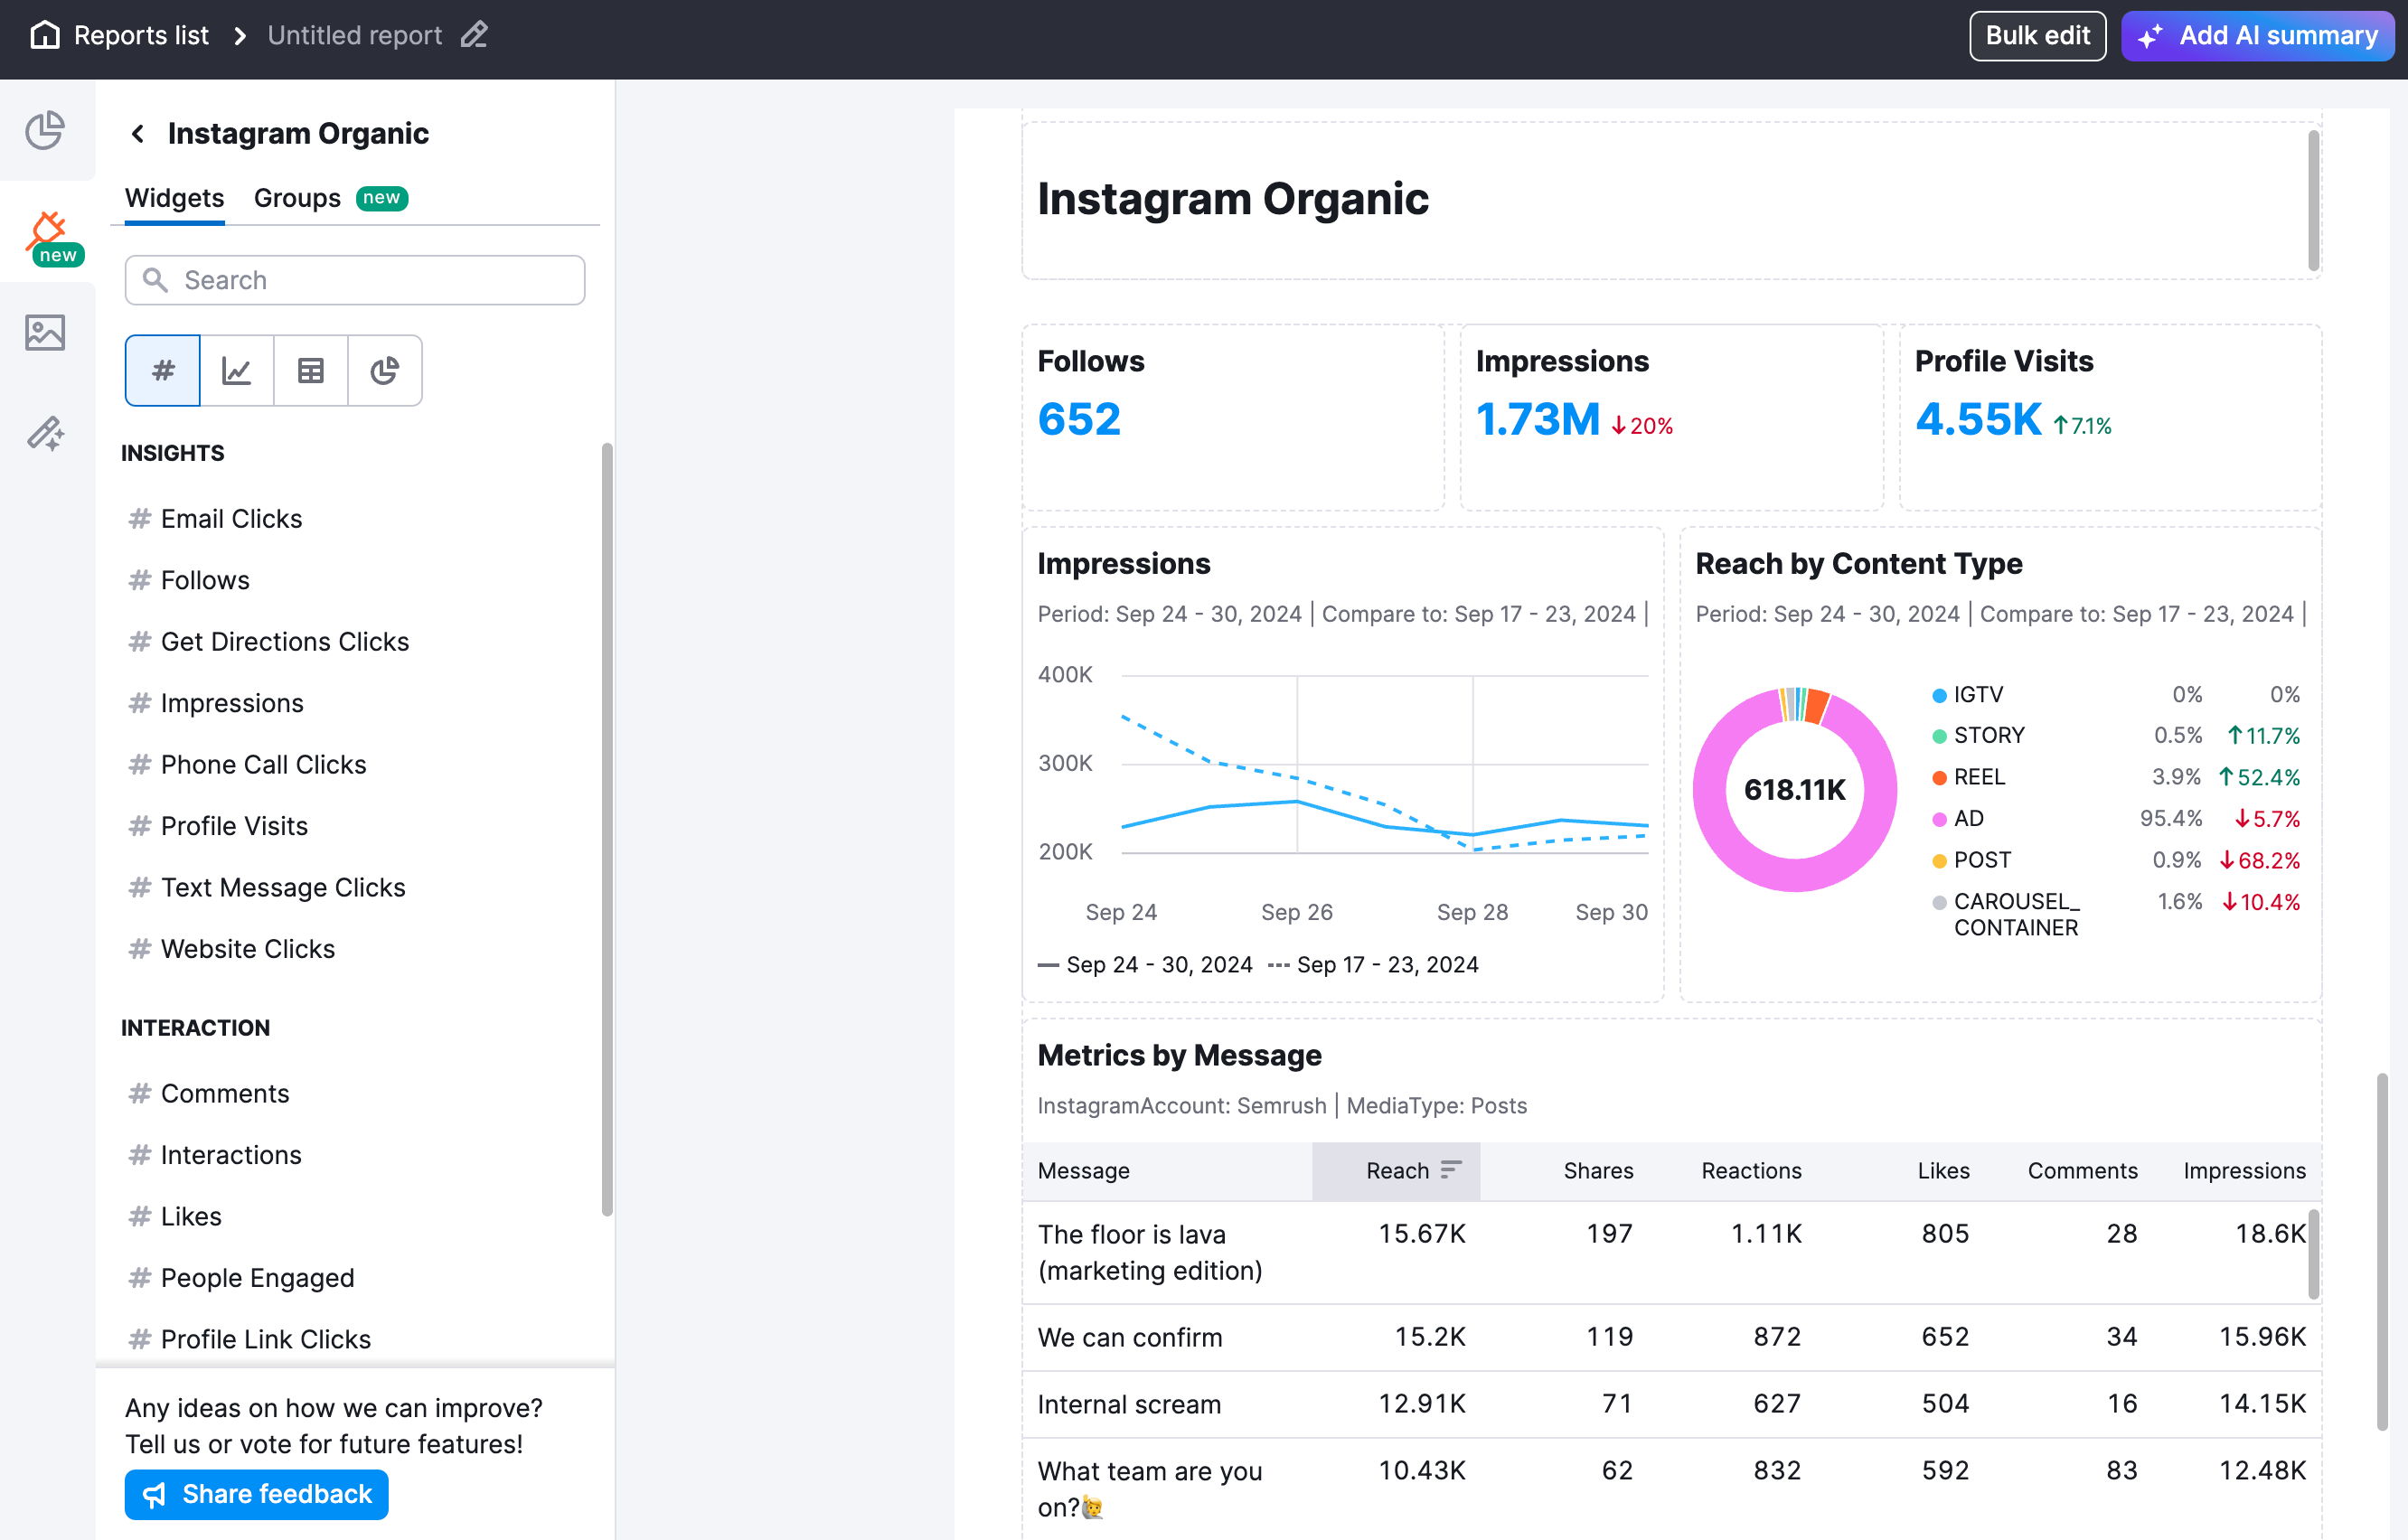
Single metrics:
INSIGHTS
- Email Clicks
- Follows
- Get Directions Clicks
- Impressions
- Phone Call Clicks
- Profile Visits
- Text Message Clicks
- Website Clicks
INTERACTION
- Comments
- Interactions
- Likes
- People Engaged
- Profile Link Clicks
- Reach
- Shares
Metrics in Table:
INTERACTION
- Contact Button Type
- Content Type
- Follow Type
MEDIA
- Message
DEMOGRAPHIC
- Age
- City
- Country
- Gender
Integrating LinkedIn Ads in My Reports allows you to track campaign performance, ad engagement, and audience demographics in one place. This integration provides deep insights into audience details like location, job function, and industry, helping you refine your targeting. With access to up to five years of historical data, you can analyze long-term trends in impressions, clicks, conversions, and ROI to optimize your ad strategies and maximize campaign effectiveness.

Single metrics:
- 50% Views
- Action Clicks
- Ad Unit Clicks
- Click Conversions
- Clicks
- Clicks to LinkedIn Pages
- Comments
- Conversion Value
- Conversions
- CPC
- CPL
- CPM
- CTR
- Engagements
- Follows
- Impressions
- Lead From Opens
- Leads
- Likes
- Opens
- Reach
- Reactions
- Sends
- Shares
- Spent
- Video Completions
- Video Views
- View Conversions
Metrics in Table:
- Ad
- Ad Account
- Ad Account Name
- Ad Group
- Ad ID
- Ad Network
- Campaign
- Campaign ID
- Company
- Company ID
- Country
- Date
Integrating LinkedIn Company Pages in My Reports allows you to monitor audience growth, post engagement, and content performance in one place. This integration provides deep insights into follower changes and unique visitors, helping you better understand your audience. With access to up to five years of historical data, you can analyze long-term trends in reach, interactions, and follower demographics to refine your LinkedIn strategy and strengthen your brand presence.

Single metrics:
FOLLOWERS ANALYTICS LIFETIME
- Total Followers
FOLLOWERS ANALYTICS TIMELINE
- New Followers
- Organic Followers Gain
- Paid Followers Gain
VISITORS ANALYTICS
- Page Views
- Unique Visitors
CONTENT ANALYTICS ORGANIC
- Organic Clicks
- Organic Comments
- Organic CTR
- Organic Engagement Rate
- Organic Impressions
- Organic Reactions
- Organic Reposts
- Organic Unique Impressions
CONTENT ANALYTICS SPONSORED
- Paid Clicks
- Paid Comments
- Paid CTR
- Paid Engagement Rate
- Paid Impressions
- Paid Reactions
- Paid Reposts
- Paid Unique Impressions
Metrics in Table:
FOLLOWERS ANALYTICS LIFETIME
- Company Size
- Industry
- Job Function
- Location
- Seniority
FOLLOWERS ANALYTICS TIMELINE
- Date
VISITORS ANALYTICS
- Date
- Device Type
- Page Type
CONTENT ANALYTICS ORGANIC
- Date
- Posts
CONTENT ANALYTICS SPONSORED
- Date
- Posts
Integrating Meta Ads in My Reports allows brands to track ad performance, audience engagement, and conversion metrics across both Facebook and Instagram. It provides insights into impressions, clicks, spend, and ROI, helping optimize ad strategies and improve campaign effectiveness across both platforms.

Single metrics:
- Amount Spent
- Clicks
- Conversion Value
- Conversions
- Cost per 1,000 People Reached
- CPC
- CPM
- CTR
- Frequency
- Impressions
- Leads
- Link Clicks
- Link CTR
- Meta Leads
- Page Engagements
- Page Likes
- Post Engagements
- Post Reactions
- Purchases ROAS
- Reach
- Website Leads
Metrics in Table:
- Ad
- Ad Campaign
- Ad Set
- Age
- Country
- Device
- Gender
- Placement
- Publisher Platform
Integrating Pinterest Ads in My Reports allows brands to track campaign performance, audience engagement, and conversion metrics. It provides insights into impressions, clicks, saves, and ad spend, helping optimize Pinterest ad strategies and enhance marketing effectiveness.
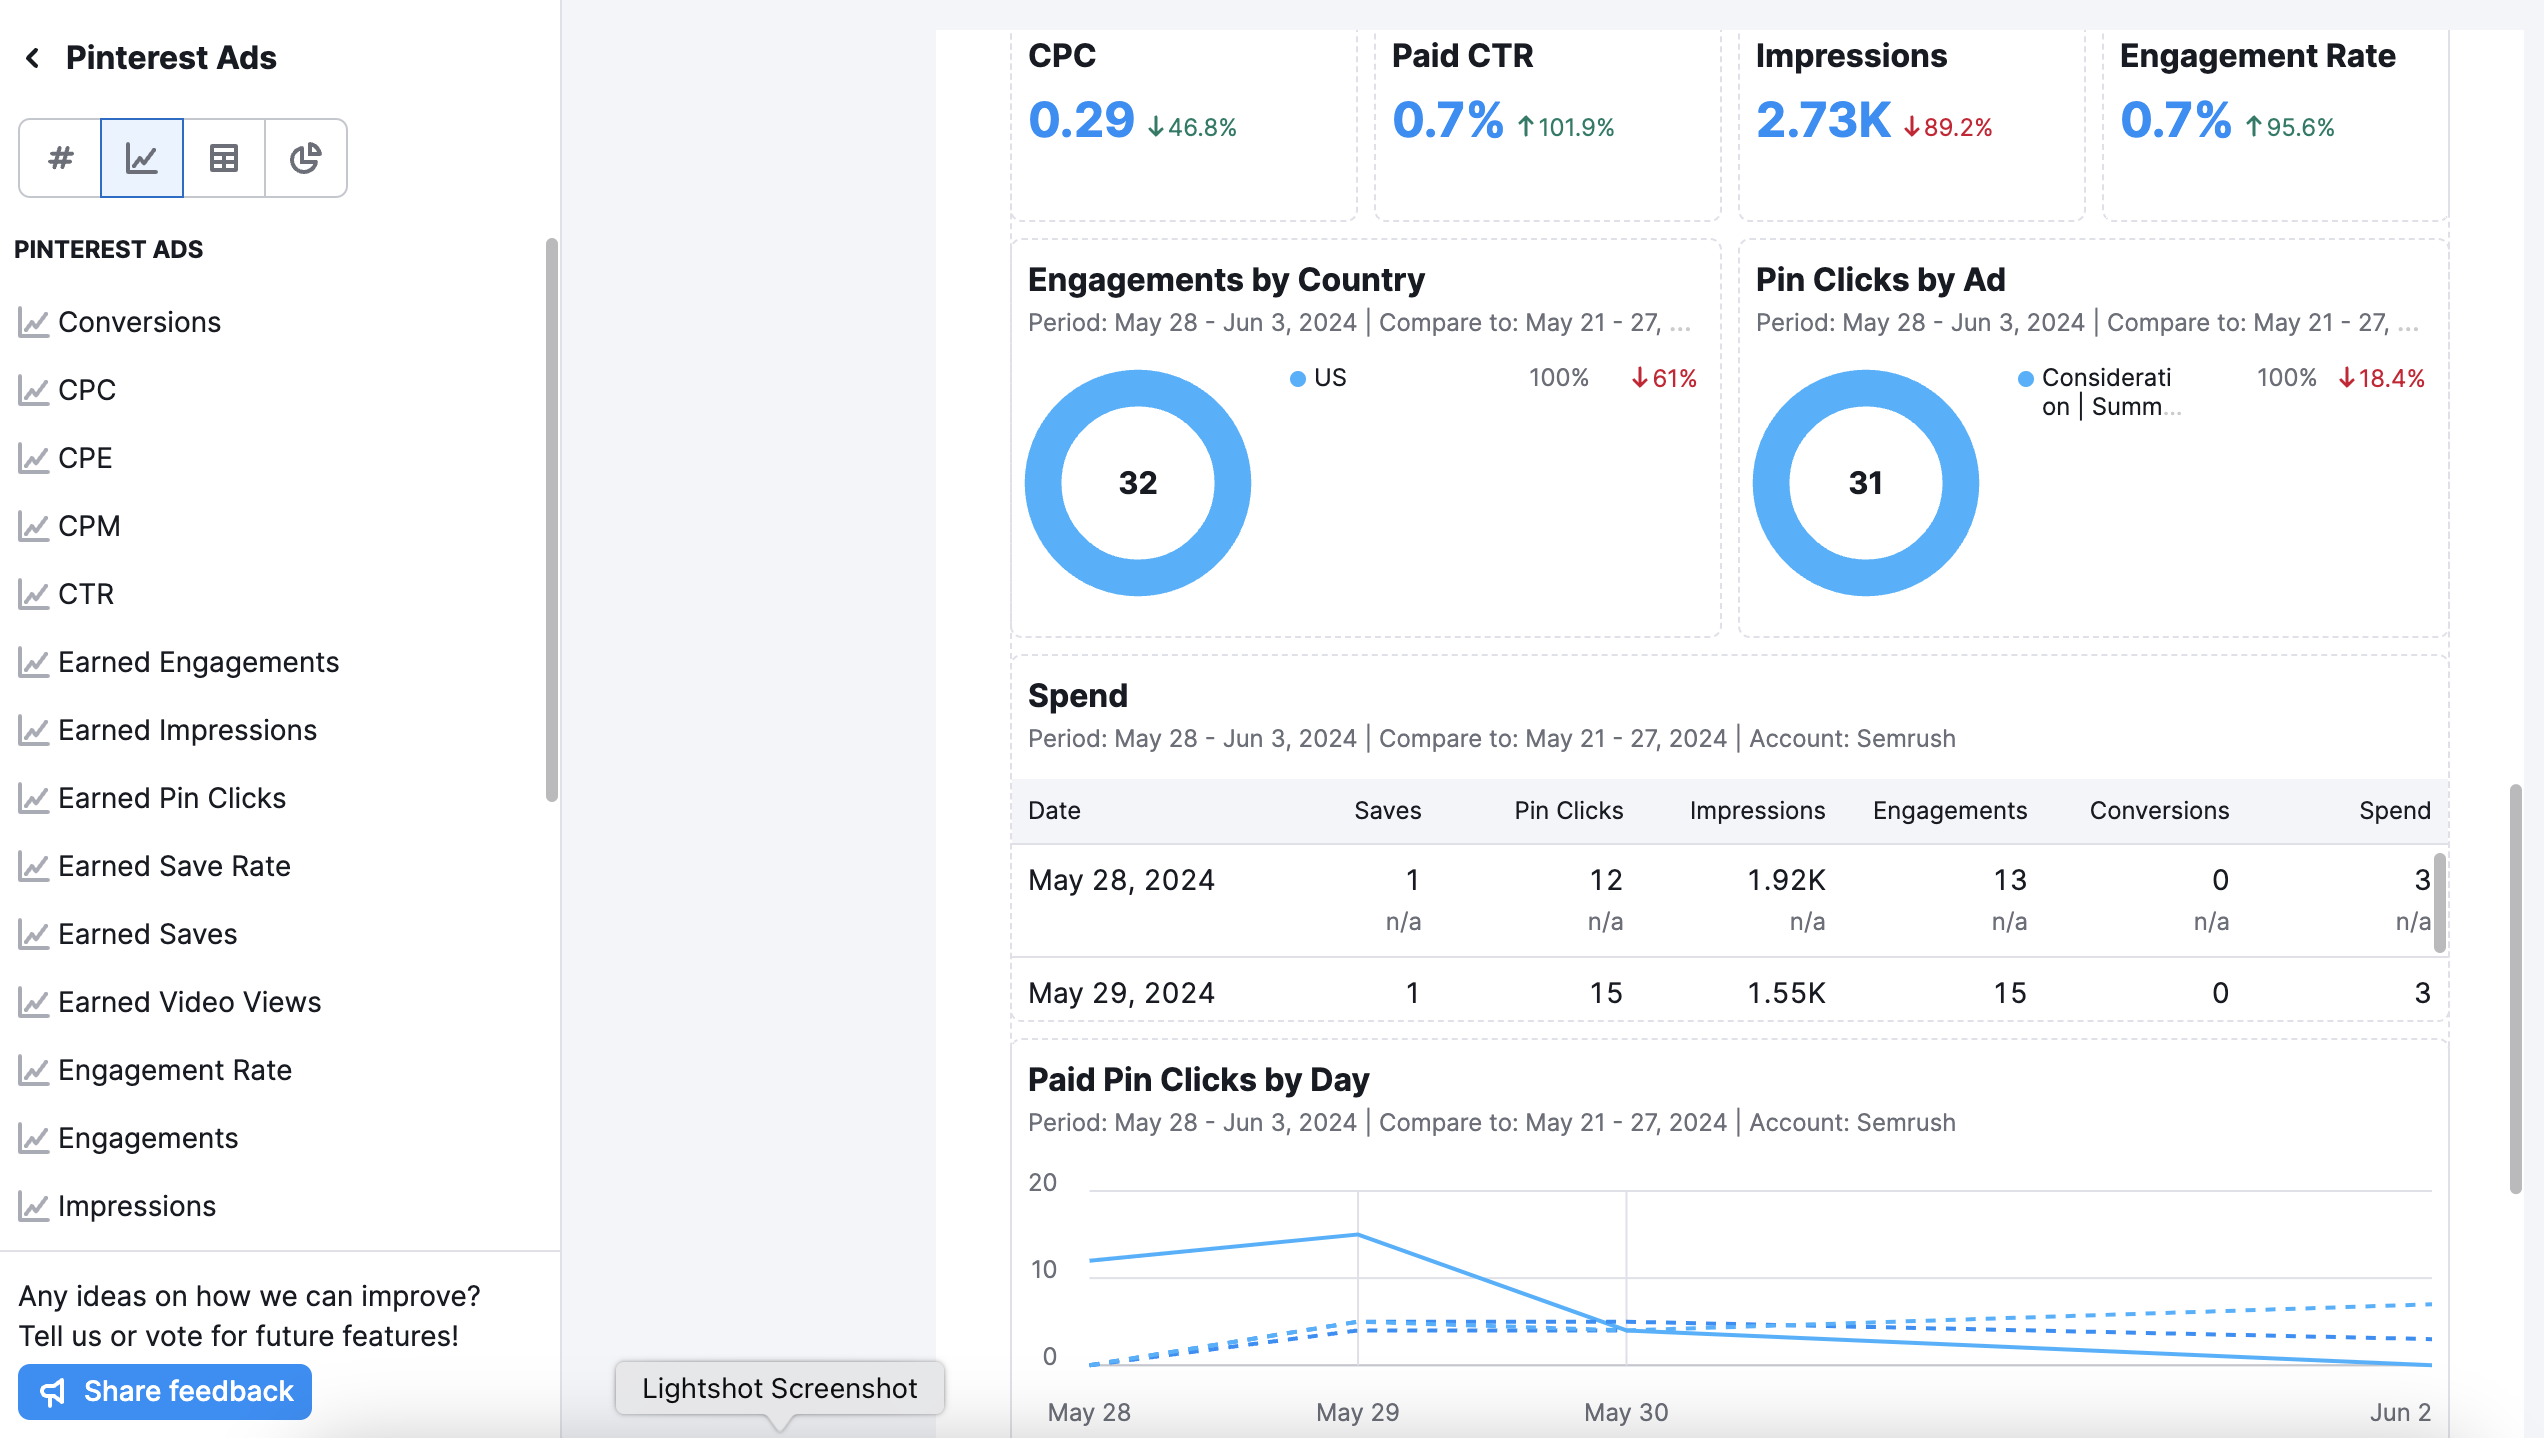
Single metrics:
- Conversions
- CPC
- CPE
- CPM
- CTR
- Earned Engagements
- Earned Impressions
- Earned Pin Clicks
- Earned Save Rate
- Earned Saves
- Earned Video Views
- Engagement Rate
- Engagements
- Impressions
- Paid CTR
- Paid Engagements
- Paid Impressions
- Paid Pin Clicks
- Paid Save Rate
- Paid Saves
- Paid Video Views
- Pin Clicks
- Save Rate
- Saves
- Spend
Metrics in Table:
- Ad
- Ad Campaign
- Ad Campaign ID
- Ad Group
- Ad Group ID
- Ad ID
- Country
- Date
Integrating Snapchat Ads in My Reports enables brands to measure ad performance, track audience interactions, and analyze conversion data. It offers insights into key metrics like impressions, swipe-ups, and cost-per-action, helping refine ad strategies and maximize campaign impact on Snapchat.
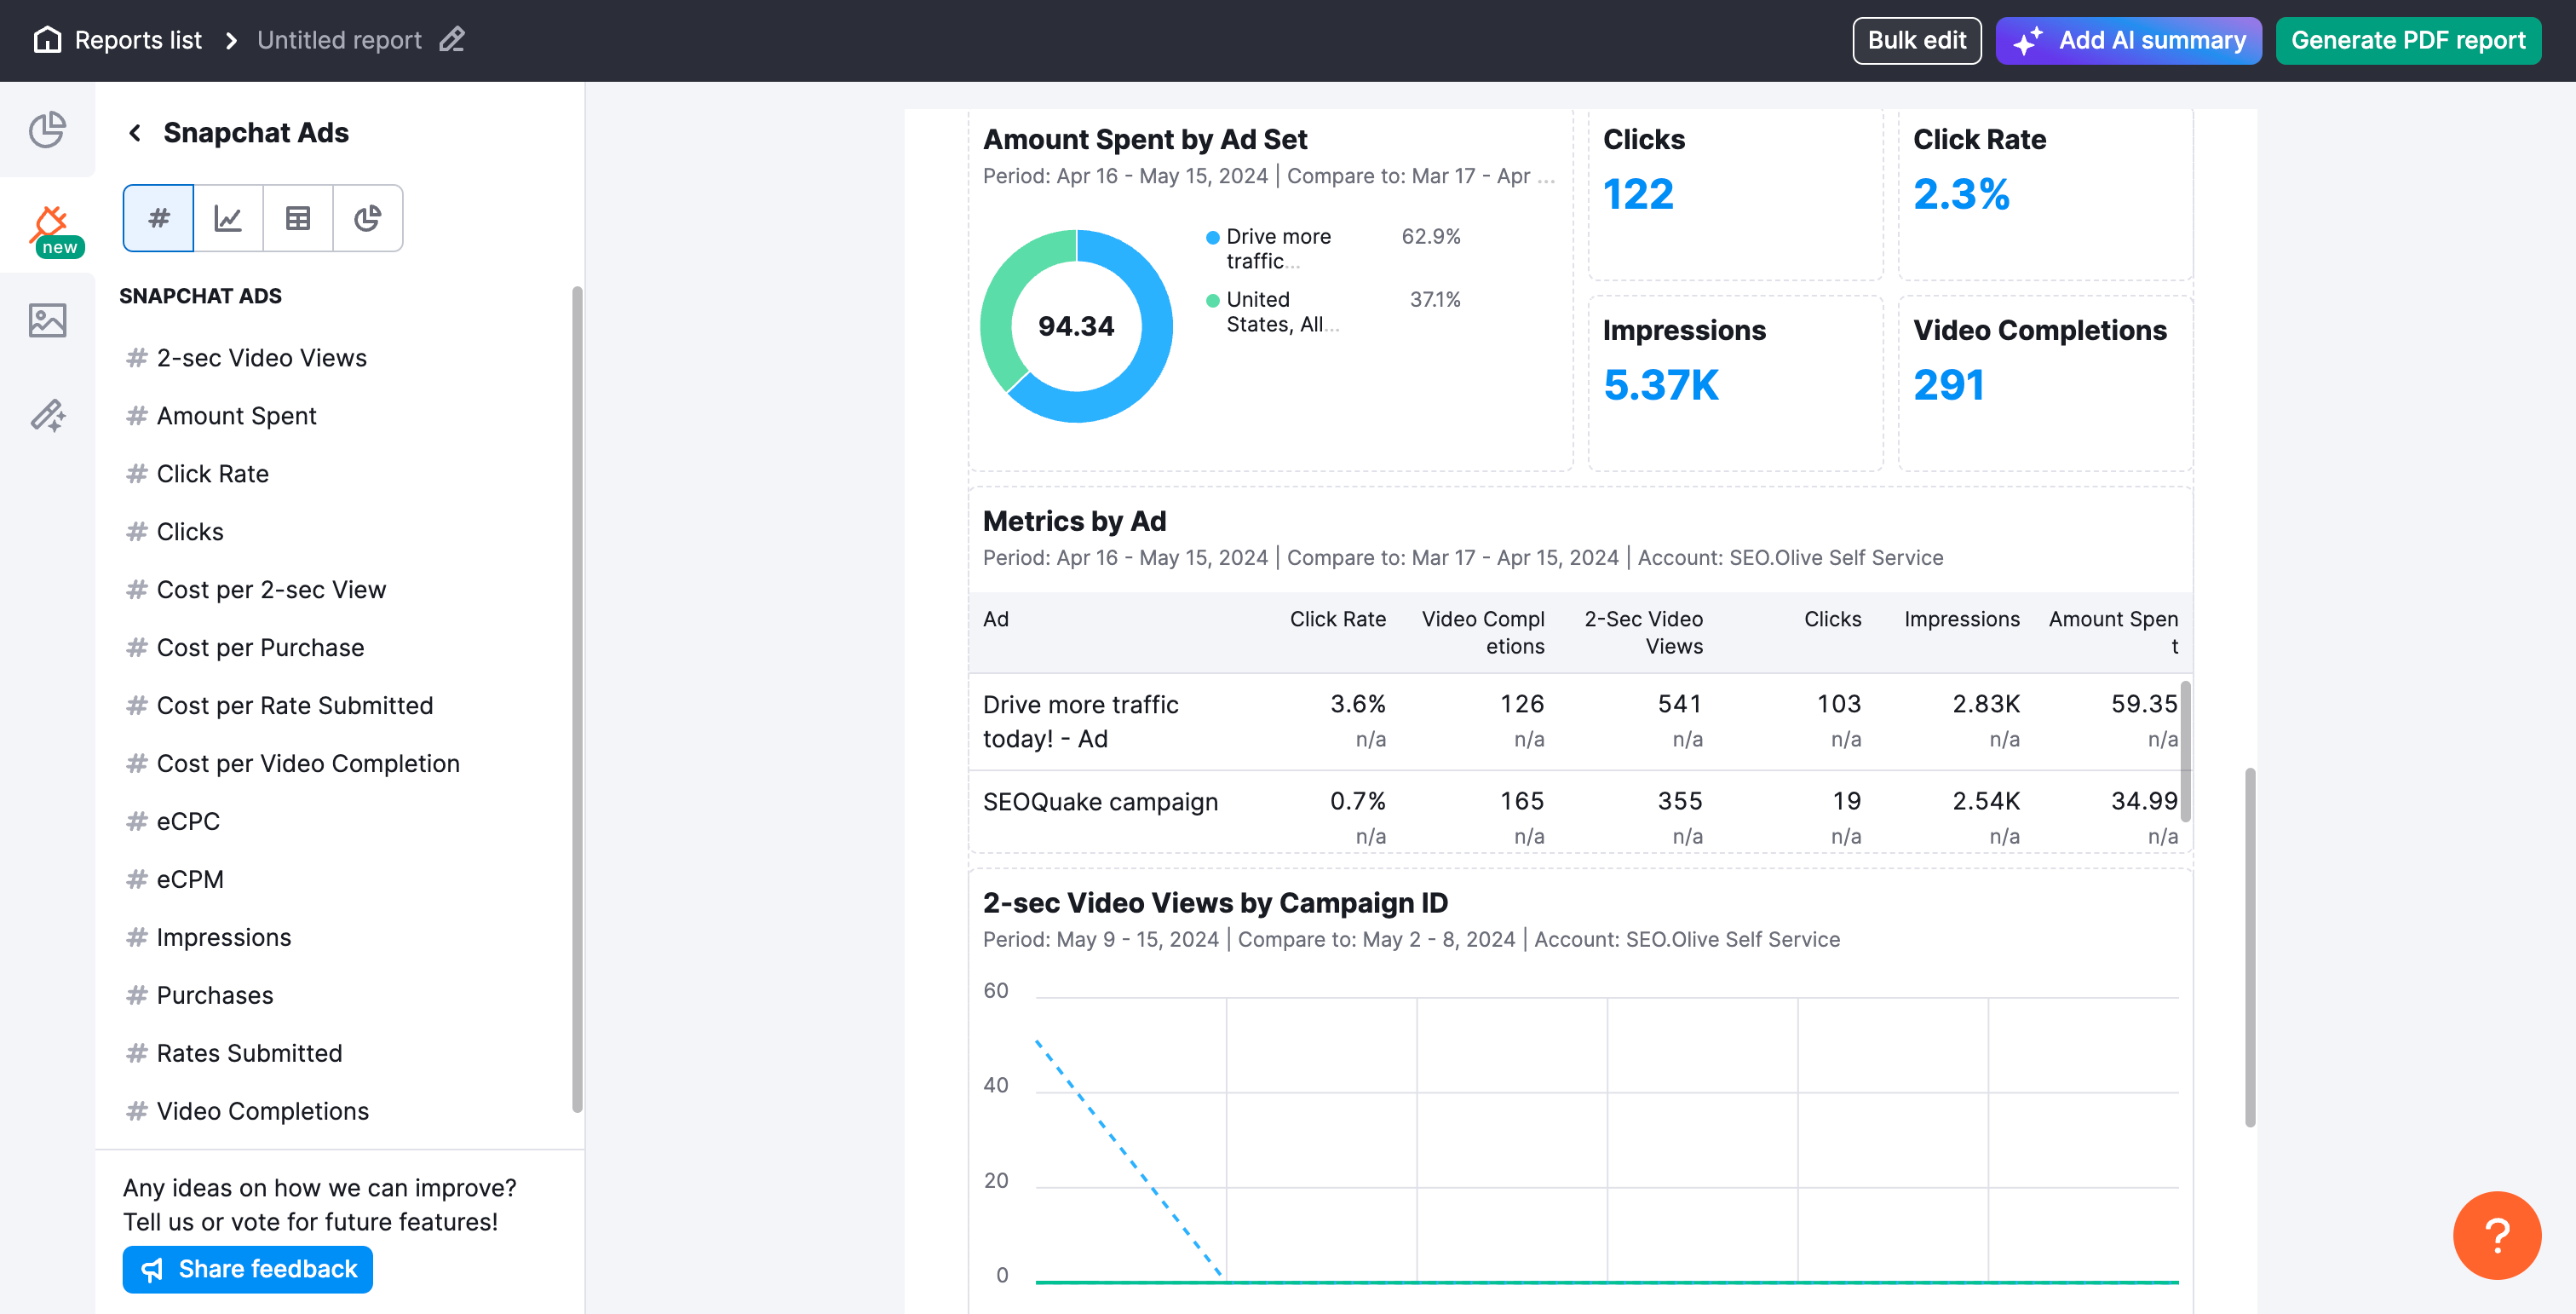
Single metrics:
- 2-sec Video Views
- Amount Spent
- Click Rate
- Clicks
- Cost per 2-sec View
- Cost per Purchase
- Cost per Rate Submitted
- Cost per Video Completion
- eCPC
- eCPM
- Impressions
- Purchases
- Rates Submitted
- Video Completions
Metrics in Table:
- Ad
- Ad ID
- Ad Set
- Ad Set ID
- Campaign
- Campaign ID
- Country
- Date
Integrating TikTok Ads in My Reports allows brands to track campaign performance, audience engagement, and conversion metrics. It provides insights into impressions, clicks, spend, and ROI, helping optimize ad strategies and improve marketing effectiveness on TikTok.

Single metrics:
TIKTOK ADS
- Clicks
- Conversion Rate
- Conversions
- Cost
- Cost Per Result
- CPA
- CPC
- CPM
- CTR
- Full views
- Impressions
- Paid Comments
- Paid Followers
- Paid Likes
- Paid Shares
- Result
- Result Rate
- Video Views
TIKTOK ADS BY AGE AND GENDER
- 50% Views
- Clicks
- Conversion Rate
- Conversions
- Cost
- Cost Per Result
- CPA
- CPC
- CPM
- CTR
- Full views
- Impressions
- Paid Comments
- Paid Followers
- Paid Likes
- Paid Shares
- Result
- Result Rate
- Video Views
Metrics in Table:
TIKTOK ADS
- Ad
- Ad Campaign
- Ad Campaign ID
- Ad Group
- Ad Group ID
- Ad ID
- Country
- Date
TIKTOK ADS BY AGE AND GENDER
- Ad
- Ad Campaign
- Ad Campaign ID
- Ad Group
- Ad Group ID
- Ad ID
- Age
- Date
- Gender
Integrating TikTok Organic in My Reports allows you to track audience growth, content performance, and engagement metrics in one place. It provides insights into follower trends, video views, and audience demographics (including age, gender, and location), helping you refine your organic TikTok strategy and measure its impact.
Note: Due to API limitations, this integration can only pull data from the last 60 days.

Single metrics:
- Comments
- Leads
- Likes
- Lost Followers
- Net Followers
- New Followers
- People Engaged
- Profile Views
- Reach
- Shares
- Video Views
- Total Followers
- Total Likes
- Video Count
Metrics in Table:
- Date
- Age
- City
- Country
- Gender
- Item ID
- Video
Integrating X (Twitter) Ads in My Reports allows brands to monitor campaign performance, audience engagement, and conversion metrics. It provides insights into impressions, clicks, spend, and engagement rates, helping optimize ad strategies and maximize results on X (Twitter).

Single metrics:
- App Clicks
- Click Rate
- Clicks
- Cost per Follow
- Cost per Lead
- Cost per Link Click
- CPC
- CPE
- CPM
- Engagement Rate
- Engagements
- Follow Rate
- Follows
- Impressions
- Lead Rate
- Leads
- Likes
- Link Click Rate
- Link Clicks
- Replies
- Retweets
- Spend
Metrics in Table:
- Ad group
- Ad group ID
- Ad network
- Campaign
- Campaign ID
- Tweet
- Tweet ID
Integrating YouTube in My Reports allows you to monitor channel growth, analyze viewing trends, and track video performance in one place. It provides insights into audience demographics, content engagement, and subscriber changes, helping you optimize your video strategy and expand your reach.
Single metrics:
- Average Video Duration
- Comments
- Dislikes
- Estimated Minutes Watched
- Likes
- Shares
- Subscribers Gained
- Subscribers Lost
- Views
Metrics in Table:
- Age
- Content Type
- Country
- Date
- Device Type
- Gender
- Video
Integrating Mailchimp in My Reports allows brands to track email campaign performance, audience growth, and engagement metrics. It provides insights into open rates, click-through rates, subscriber activity, and conversions, helping optimize email marketing strategies and improve outreach effectiveness.
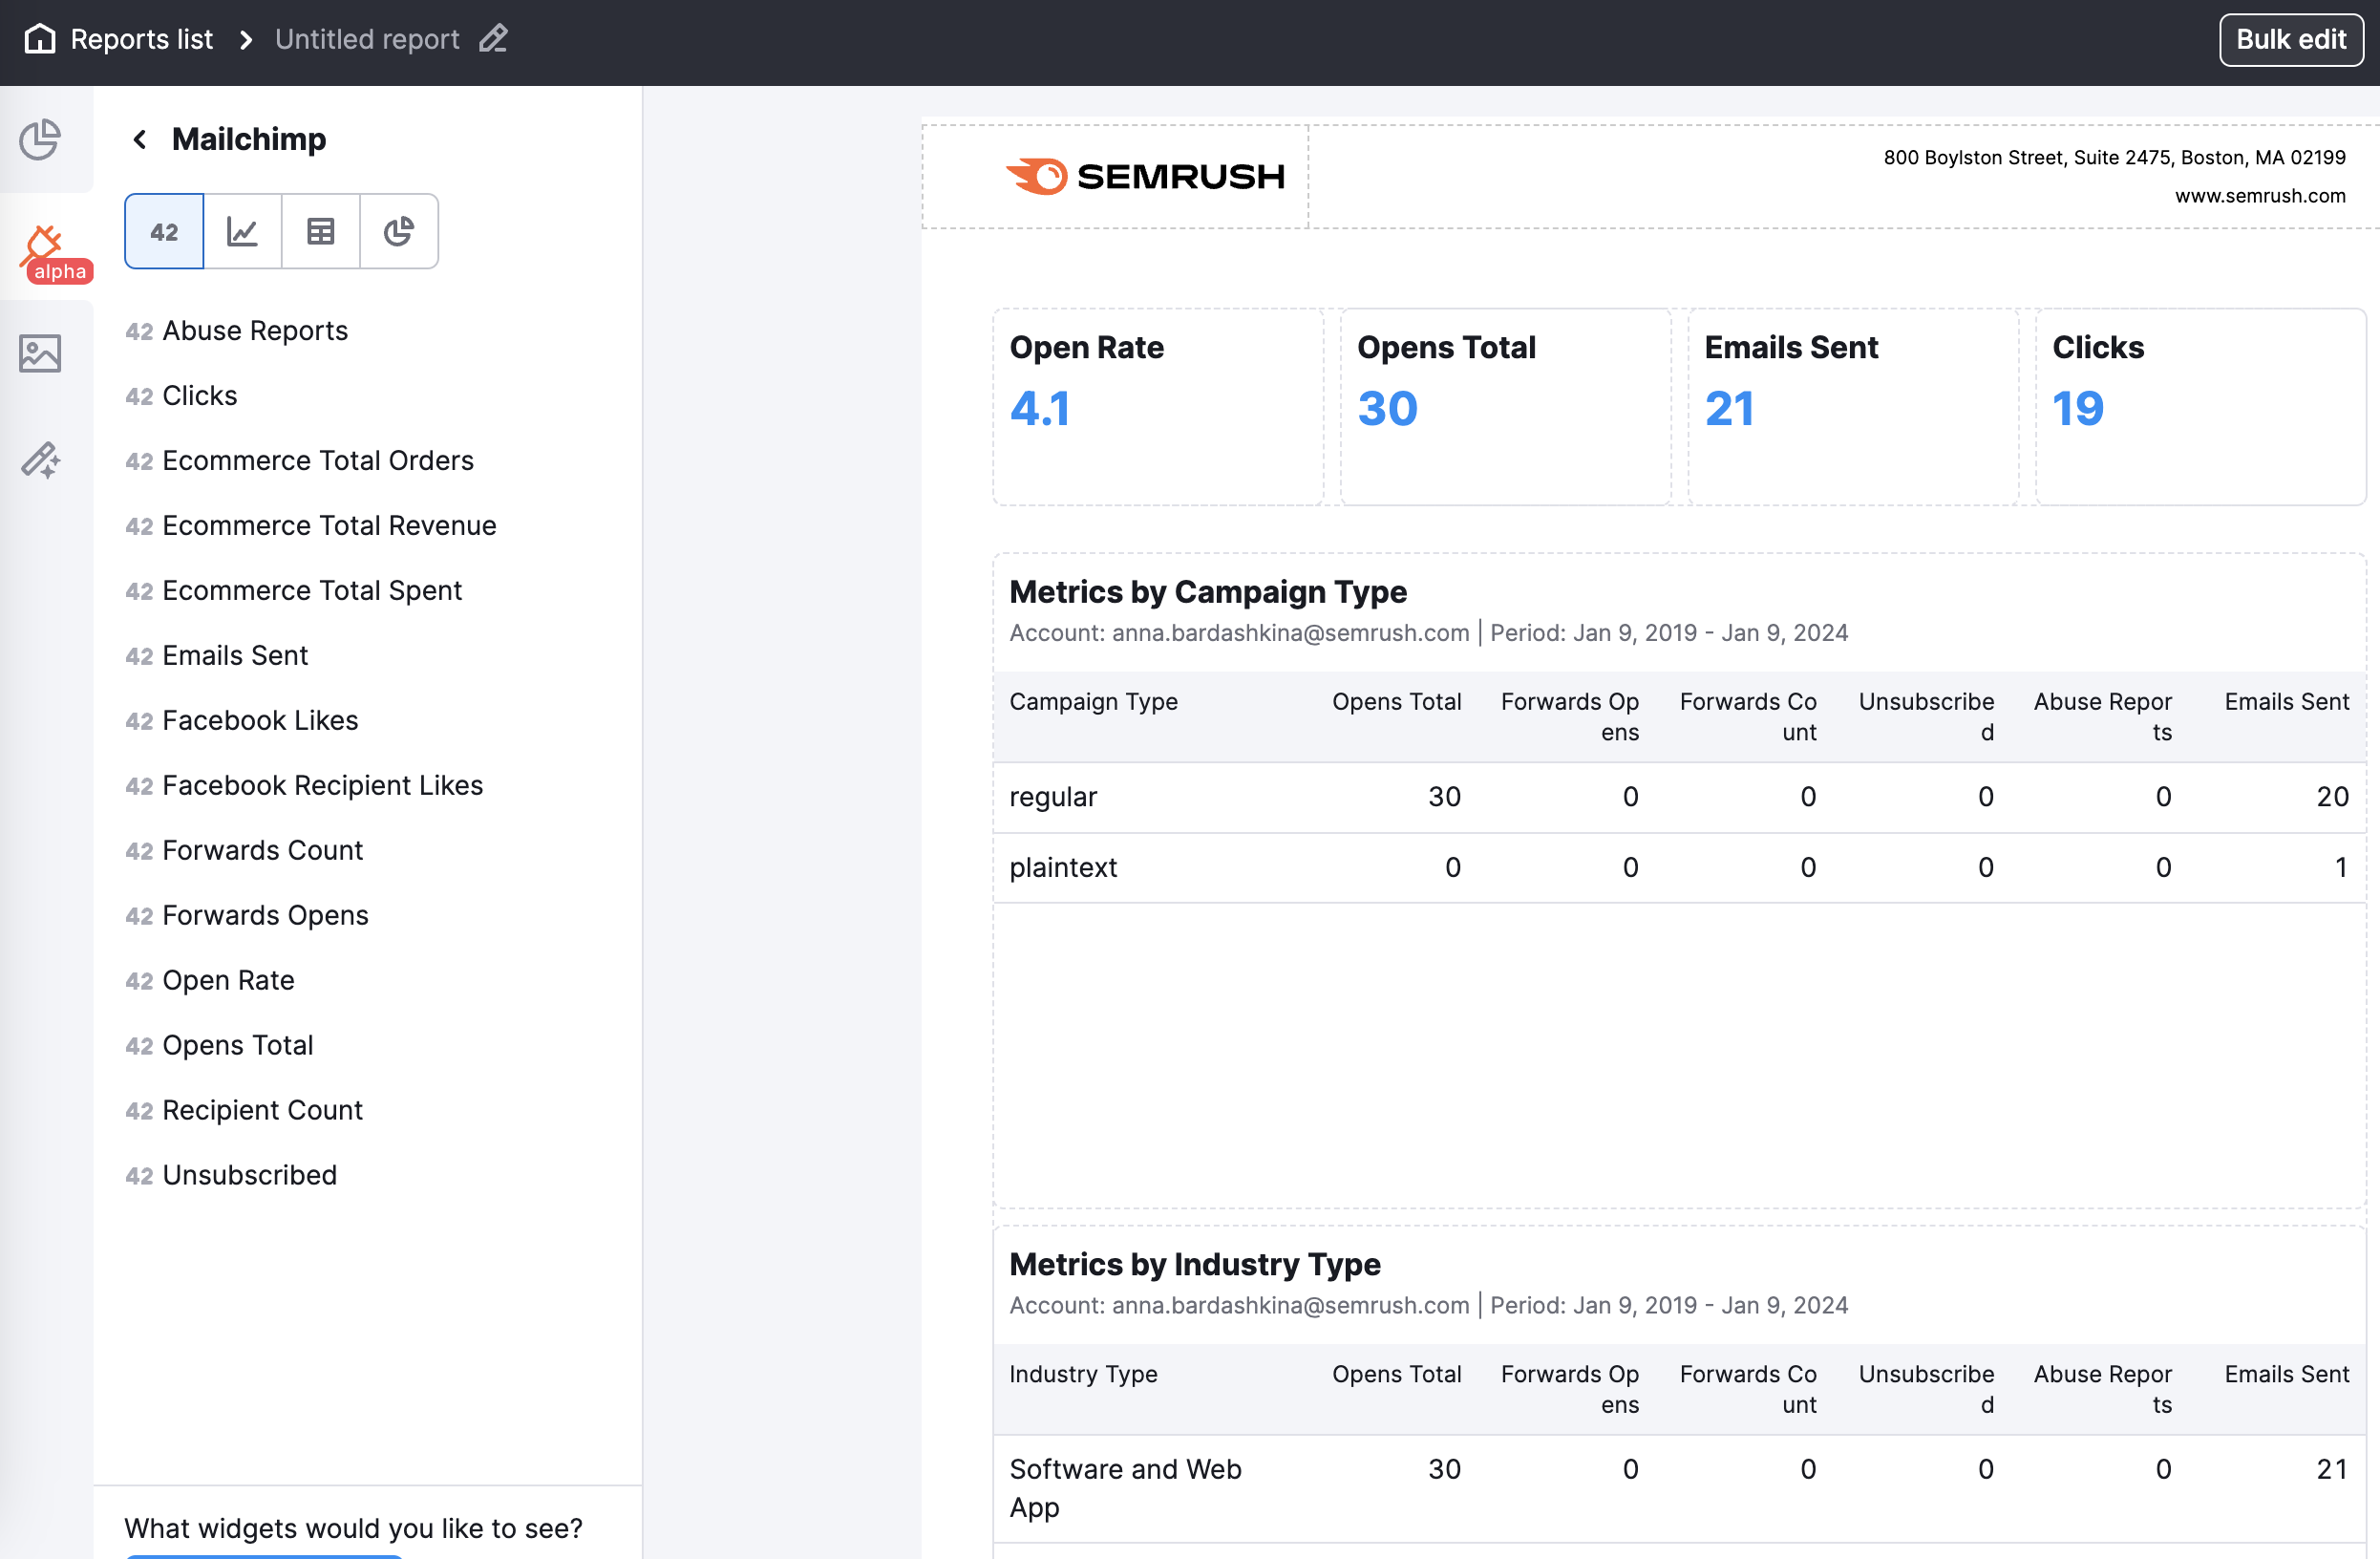
Single metrics:
- Abuse Reports
- Clicks
- Ecommerce Total Orders
- Ecommerce Total Revenue
- Ecommerce Total Spent
- Emails Sent
- Facebook Likes
- Facebook Recipient Likes
- Forwards Count
- Forwards Opens
- Open Rate
- Opens Total
- Recipient Count
- Unsubscribed
Metrics in Table:
- Campaign Type
- Currency
- Date
- Email Campaign
- Email Campaign ID
- Industry Type
- List
- List ID
- List is Active
Integrating Klaviyo in My Reports allows brands to track email and SMS campaign performance, audience growth, and customer engagement. It provides insights into open rates, click-through rates, revenue attribution, and subscriber behavior, helping optimize marketing automation and improve retention strategies.
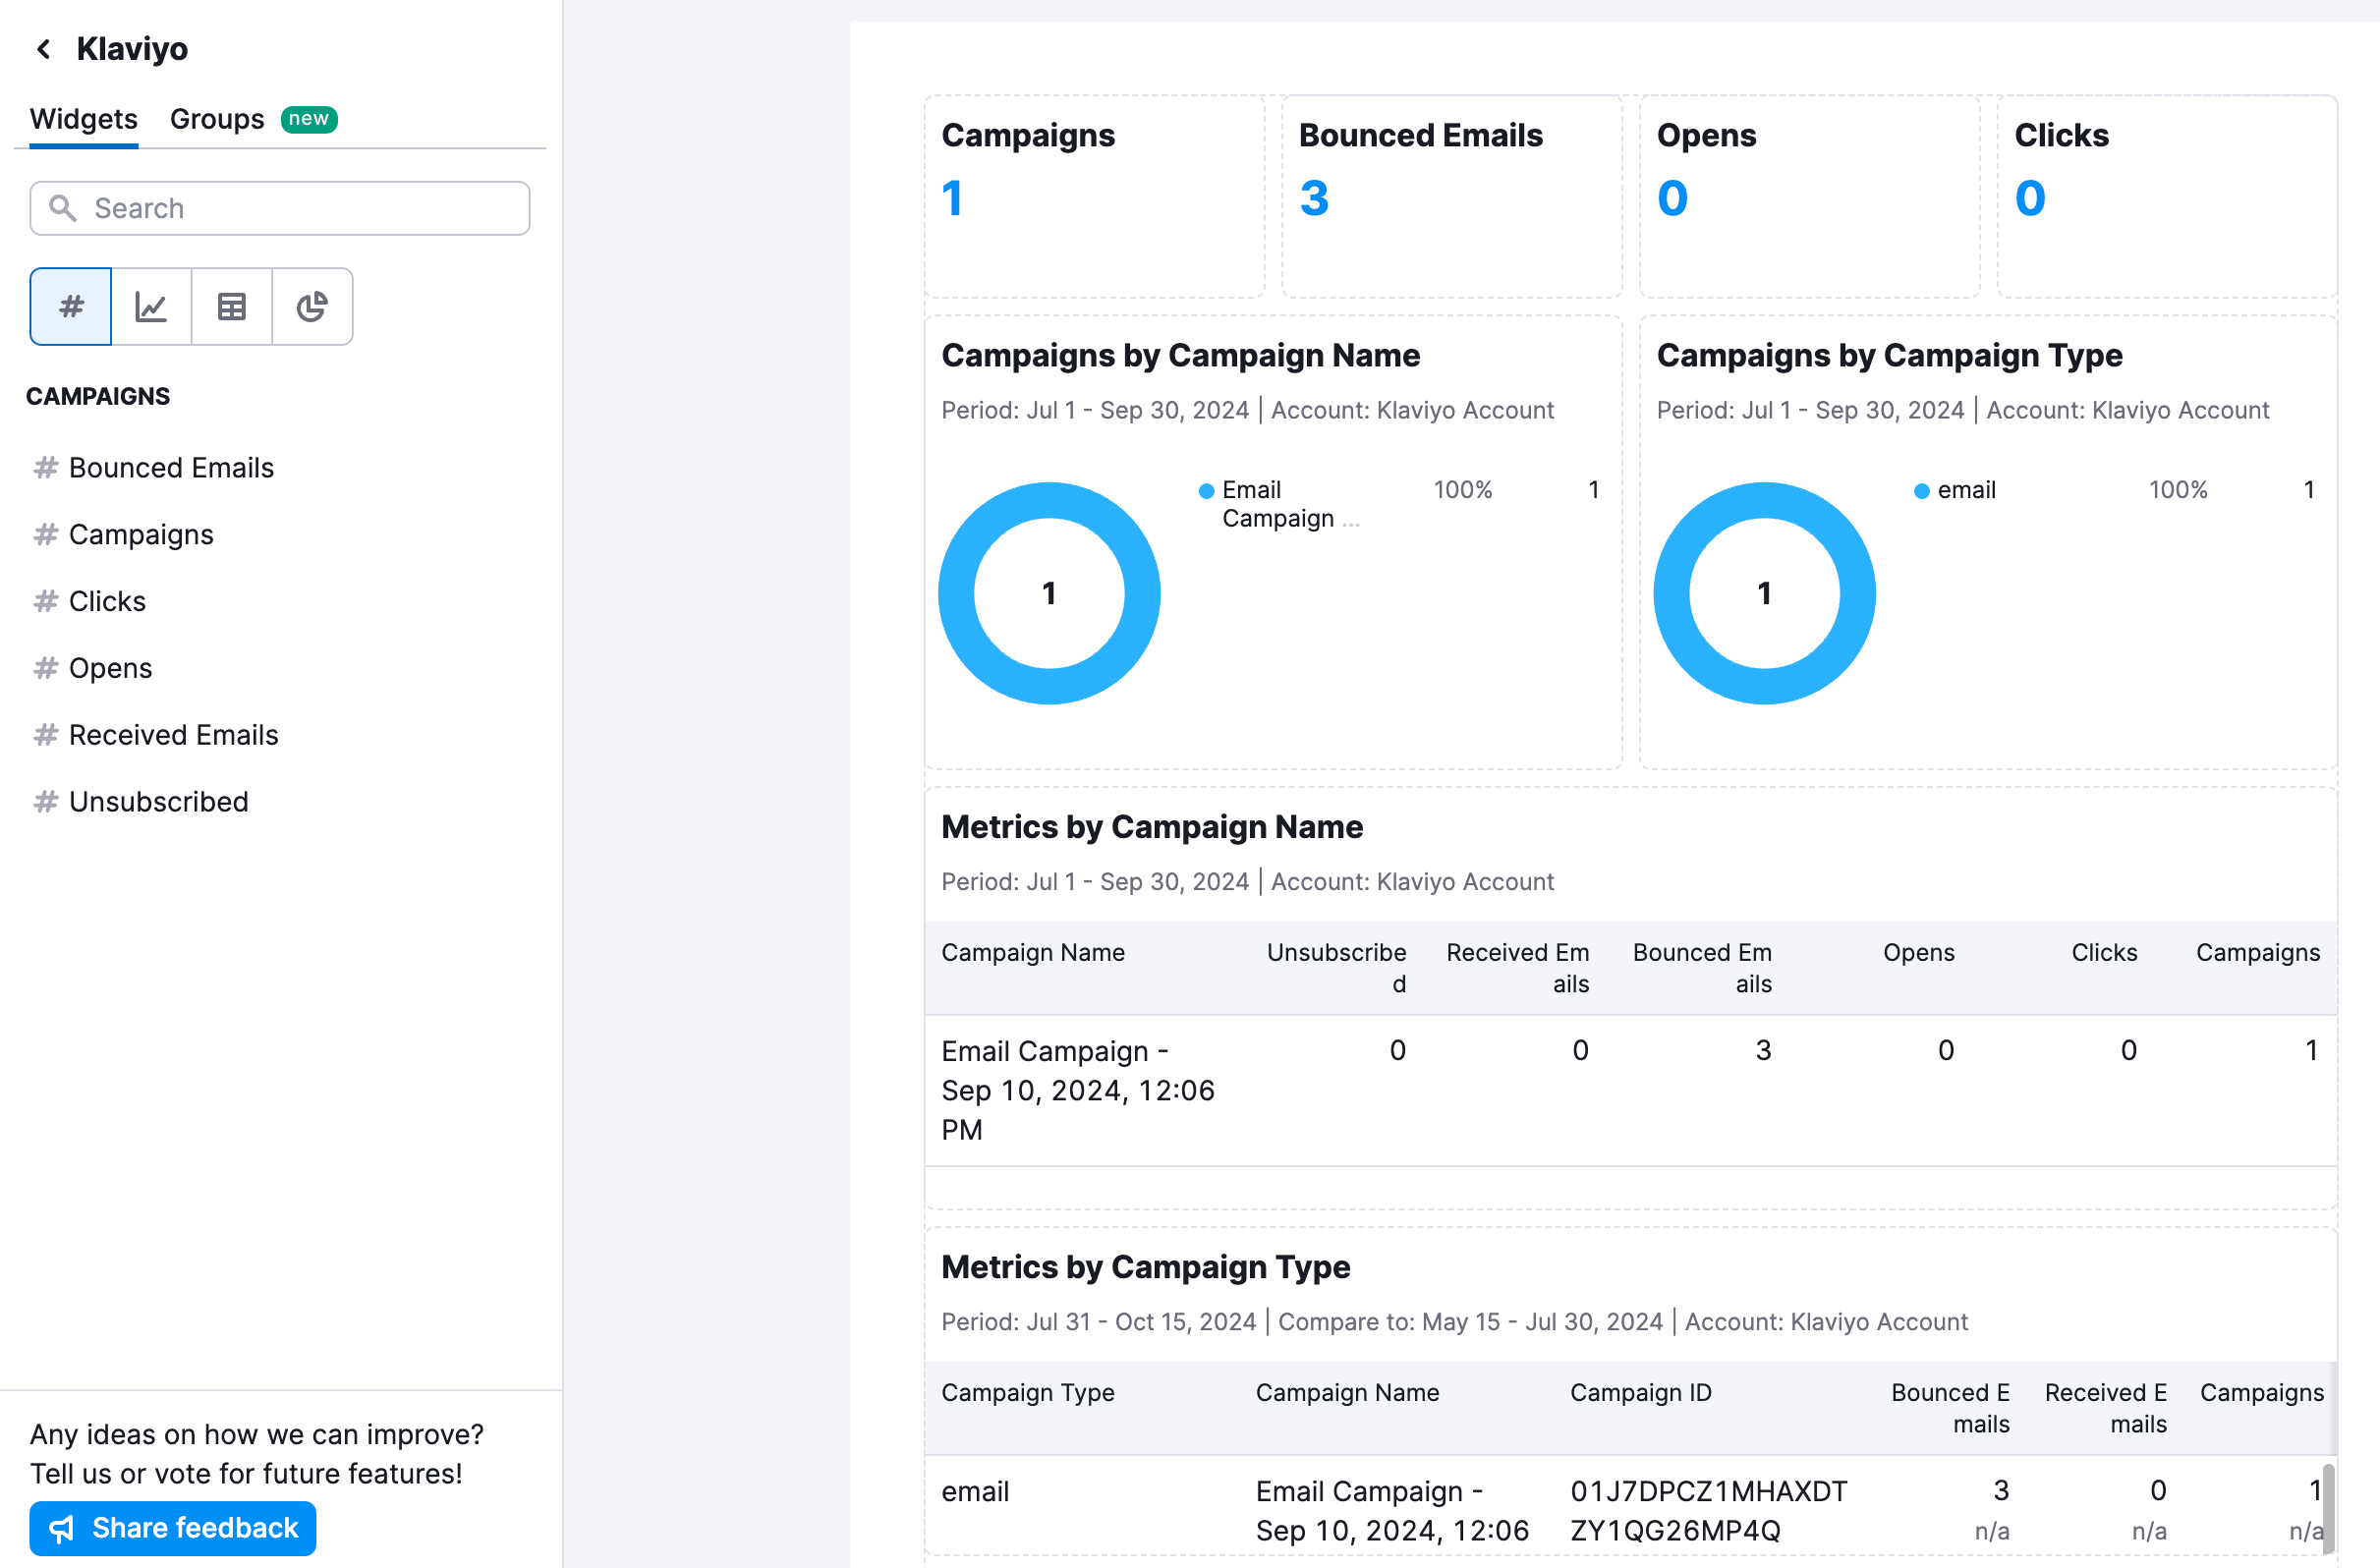
Single metrics:
- Bounced Emails
- Campaigns
- Clicks
- Opens
- Received Emails
- Unsubscribed
Metrics in Table:
- Campaign ID
- Campaign Name
- Campaign Status
- Campaign Type
- Date
Integrating Constant Contact in My Reports allows brands to track email campaign performance, list health, and content engagement in one place. It provides insights into key metrics like open rates, click-through rates, and unsubscribes, helping you compare performance across different campaigns and identify your most compelling content.

Single metrics:
- All Opens
- Bounce Rate
- Bounces
- Click Rate
- Clicks
- Did Not Open
- Emails Sent
- Forwards
- Open Rate
- Opens
- Unsubscribed
- Unsubscribed Rate
- Lists Count
Metrics in Table:
- Campaign Type
- Email Campaign
- List
E-commerce
Integrating Amazon Brand Ads in My Reports allows brands to track campaign performance, audience engagement, and sales impact. It provides insights into impressions, clicks, conversions, and ad spend, helping optimize sponsored brand strategies and improve visibility on Amazon.
Single metrics:
AMAZON BRAND ADS SEARCH TERM
- Campaign Budget Amount
- Clicks
- Cost
- Impressions
- Sales
- Sales Clicks
- Video 5 Complete Views
- Video 5 Second View Rate
- Video 5 Second Views
- Video First Quartile Views
- Video Midpoint Views
- Video Third Quartile Views
- Video Unmutes
- Viewable Impressions
AMAZON BRAND ADS
- Adds to Cart
- AdNetwork Installs
- All Conversions
- Clicks
- Conversions
- Impressions
- Link Clicks
- Purchases
- Spend
Metrics in Table:
AMAZON BRAND ADS SEARCH TERM
- Ad Campaign
- Ad Campaign ID
- Ad Group
- Ad Group ID
- Campaign Budget Type
- Campaign Status
- Date
- Keyword Bid
- Keyword ID
- Keyword Status
- Keyword Text
- Match Type
- Search Term
AMAZON BRAND ADS
- Ad
- Ad Campaign
- Ad Campaign ID
- Ad Group
- Ad Group ID
- Ad ID
- Country
- Date
Integrating Amazon Display Ads in My Reports enables brands to monitor ad reach, engagement, and conversion performance across Amazon and third-party sites. It offers insights into impressions, view-through rates, clicks, and ROAS, helping refine targeting strategies and maximize advertising effectiveness.
Single metrics:
- Adds to Cart
- AdNetwork Installs
- All Conversions
- Clicks
- Conversions
- CTR
- Impressions
- Link Clicks
- Purchases
- Spend
Metrics in Table:
- Ad
- Ad Campaign
- Ad Campaign ID
- Ad Group
- Ad Group ID
- Ad ID
- Country
- Date
Integrating Amazon Product Ads in My Reports allows brands to track ad performance, product visibility, and sales impact. It provides insights into impressions, clicks, conversions, and ad spend, helping optimize sponsored product campaigns and improve placement within Amazon’s marketplace.
Single metrics:
- Clicks
- CPC
- CTR
- Impressions
- Purchases
- Spend
Metrics in Table:
- Ad Campaign
- Ad Campaign ID
- Ad Group
- Ad Group ID
- Ad ID
- Country
- Date
Integrating BigCommerce in My Reports allows brands to monitor store performance, track sales trends, and analyze customer behavior in a centralized report. It provides insights into key metrics such as revenue, order volume, conversion rates, average order value, and product performance.
By combining BigCommerce data with other marketing and sales insights, businesses can identify trends, optimize product listings, and refine eCommerce strategies to drive growth and improve customer experience.
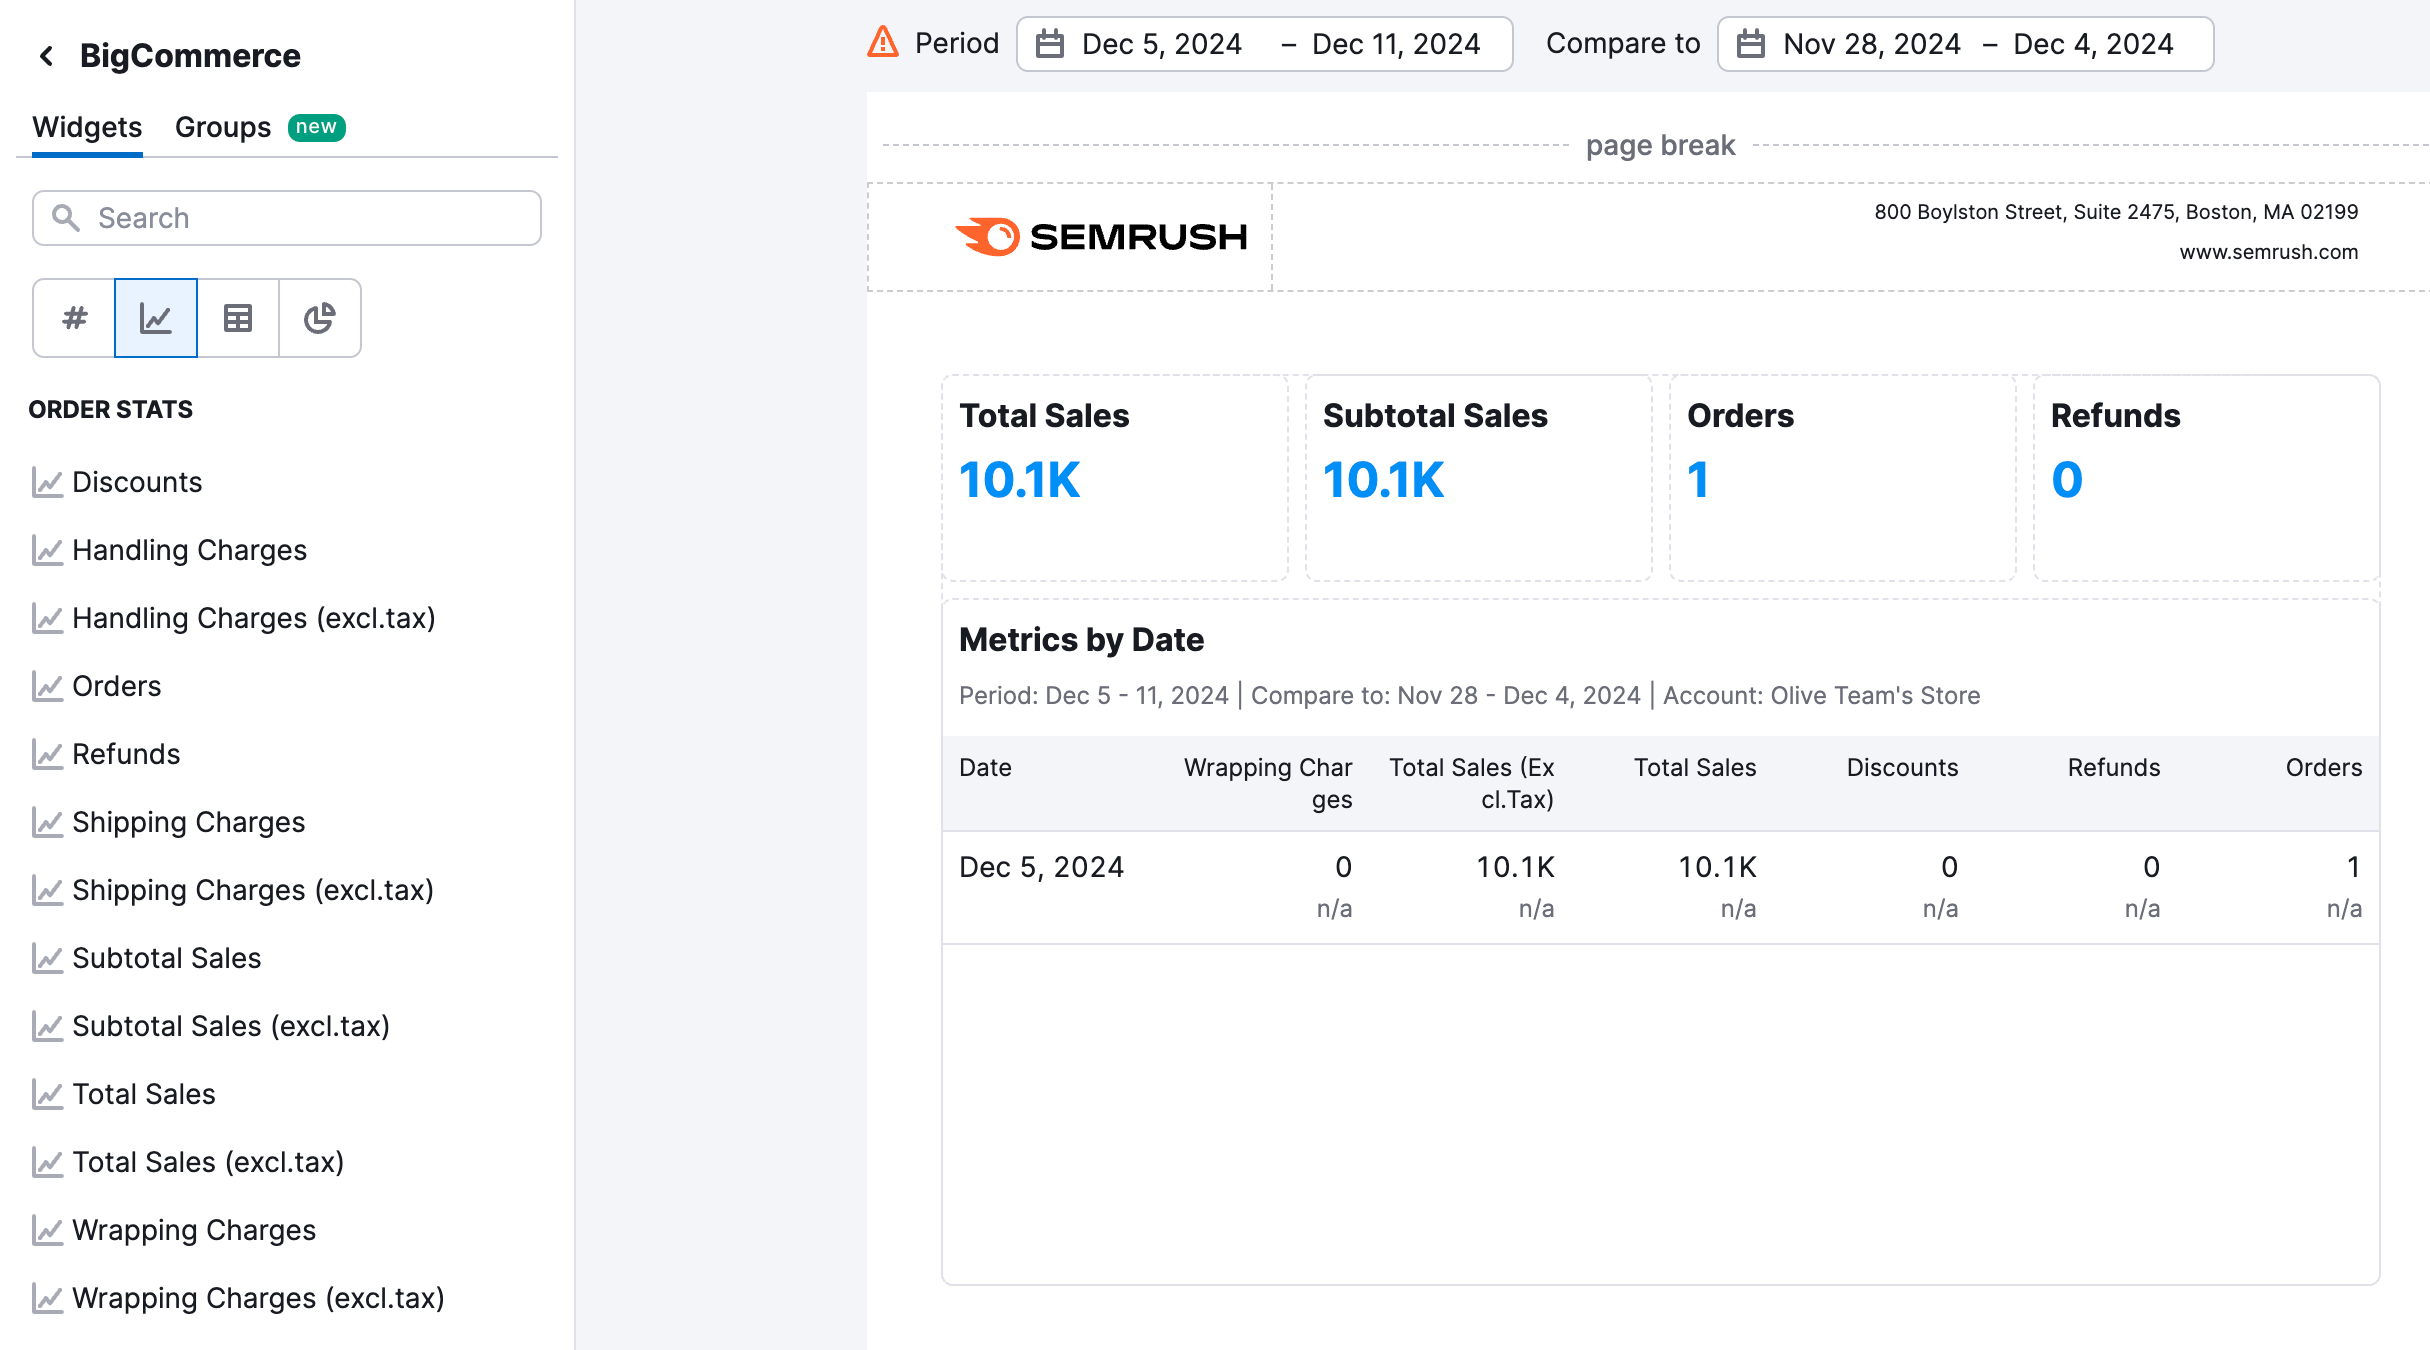
Single metrics:
ORDER STATS
- Discounts
- Handling Charges
- Handling Charges (excl.tax)
- Orders
- Refunds
- Shipping Charges
- Shipping Charges (excl.tax)
- Subtotal Sales
- Subtotal Sales (excl.tax)
- Total Sales
- Total Sales (excl.tax)
- Wrapping Charges
- Wrapping Charges (excl.tax)
Metrics in Table:
ORDER STATS
- Date
Integrating Shopify in My Reports provides brands with a centralized view of store performance, sales trends, and customer insights. By tracking key metrics such as revenue, order volume, conversion rates, and product performance, businesses can gain a clearer understanding of their eCommerce success.
With this integration, brands can benefit by:
- Monitoring Sales Performance – Analyze revenue trends, average order value, and seasonal fluctuations.
- Understanding Customer Behavior – Track new vs. returning customers, purchase patterns, and lifetime value.
- Optimizing Product Strategy – Identify top-performing products and adjust inventory or pricing based on demand.
- Evaluating Marketing Impact – Measure how different traffic sources contribute to conversions and refine advertising efforts.

Single metrics:
ORDERS
- Discounts
- Duties
- Fees
- Giftcard Sales
- Gross Sales
- Returns
- Shipping
- Shipping (Tax Incl.)
- Shipping Taxes
- Taxes
- Total Sales
PRODUCTS
- Products Sold
TOTALS
- Discounts
- Duties
- Fees
- Fulfilled Orders
- Giftcard Sales
- Gross Sales
- Net Orders
- Refund Amount
- Refunded Orders
- Return Amount
- Returned Orders
- Shipping
- Shipping (Tax Incl.)
- Shipping Taxes
- Taxes
- Total Orders
- Voided Orders
Metrics in Table:
ORDERS
- Financial Status
- Fulfillment Status
- Online Store
- Order ID
- Order Name
- Order Status
- Returned Status
- Sales Channel
- Shop
PRODUCTS
- Product ID
- Product Name
- Product SKU
- Product Variant
- Product Vendor
TOTALS
- Date
Integrating WooCommerce in My Reports allows brands to track store performance, sales trends, and customer insights in one place. Key metrics like revenue, order volume, and conversion rates help businesses understand sales patterns and customer behavior.
By combining WooCommerce data with other marketing and sales insights, brands can identify opportunities for growth, optimize product offerings, and improve their overall eCommerce strategy.
Single metrics:
ORDERS
- Discounted Orders
- Discounts
- Fees
- Gross Sales
- Items Sold
- Net Sales
- Returns
- Shipping
- Shipping (Tax Incl.)
- Shipping Taxes
- Taxes
- Total Sales
PRODUCTS
- Discounts
- Gross Sales
- Items Sold
- Net Sales
- Tax
TOTALS
- Discounts
- Gross Sales
- Items Sold
- Net Sales
- Returned Orders
- Shipping
- Taxes
- Total Orders
Metrics in Table:
ORDERS
- Online Store
- Order Number
- Order Status
PRODUCTS
- Order Number
- Order Status
- Product ID
- Product Name
- Product SKU
TOTALS
- Date
CRM
Integrating HubSpot CRM in My Reports allows you to monitor sales performance and customer relationship data in a single dashboard. This integration provides deep insights into your sales pipeline, including lead progression, deal stages, and revenue forecasting. With access to up to five years of historical data, you can analyze long-term trends to track team performance, identify opportunities, and gain a clearer understanding of your sales operations.

Single metrics:
- Calls
- Companies
- Company Contacts
- Company Deals
- Company Total Revenue
- Contacts
- Closed Amount
- Closed Lost Amount
- Closed Won Amount
- Deal Amount
- Deals
- Forecast Amount
- Lost Deals
- MRR
- Total Contract Value
- Won Deals
- Leads
- Meetings
- Tasks
Metrics in Table:
CALLS
- Call Direction
- Call Source
- Call Status
- Call Title
COMPANIES
- Company Country / Region
- Company Industry
- Company Lead Status
- Company Lifecycle Stage
- Company Name
- Company Type
DEALS
- Closed Lost Reason
- Closed Won Reason
- Deal Name
- Deal Priority
- Deal Stage
- Deal Type
LEADS
- Lead ID
- Lead Label
- Lead Type
MEETINGS
- Meeting Location Type
- Meeting Name
- Meeting Outcome
TASKS
- Priority
- Queue
- Task Status
- Task Title
- Task Type
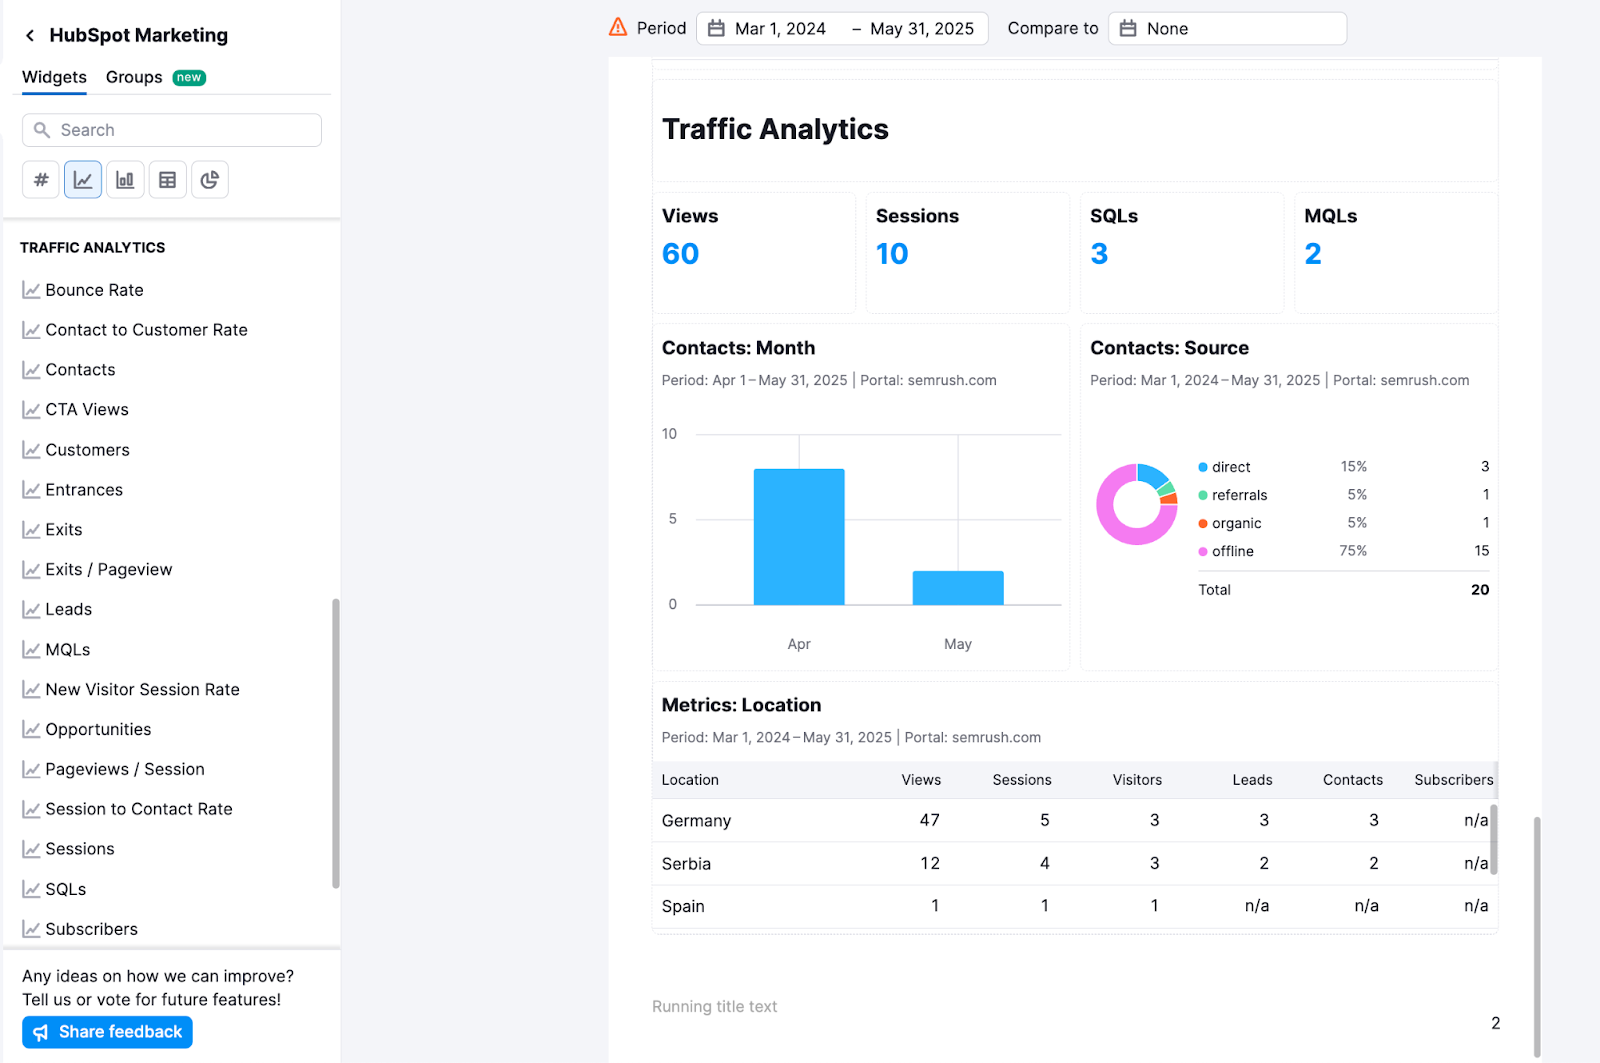
Integrating HubSpot Marketing in My Reports allows you to track email campaigns, form performance, and website traffic analytics in a single dashboard. This integration provides insights into lead sources, visitor behavior, and page performance, helping you understand the entire customer journey. With access to up to 1.5 years of historical data, you can analyze long-term trends to optimize your marketing funnel and demonstrate ROI.


Single metrics:
EMAIL STATS
- Bounces
- Clicks
- Emails Opened
- Emails Sent
- Emails Delivered
- Emails Not Sent
- Emails Suppressed
- Click Rate
- CTR
- Hard Bounces
- Replies
- Soft Bounces
- Spam Reports
- Bounce Rate
- Unsubscribes
FORM STATS
- Form Submissions
- Form Views
- Submissions / View
TRAFFIC STATS
- Sessions
- Visitors
- Leads
- Contacts
- Subscribers
- MQLs
- SQLs
- Opportunities
Metrics in Tables:
EMAIL STATS
- Email Campaign
- Email Name
- Email Type
- Device
FORM STATS
- Date
- Form Name
- Placement
TRAFFIC STATS
- Source
- Location
- Email Campaign
- Blog Post
- Landing Page
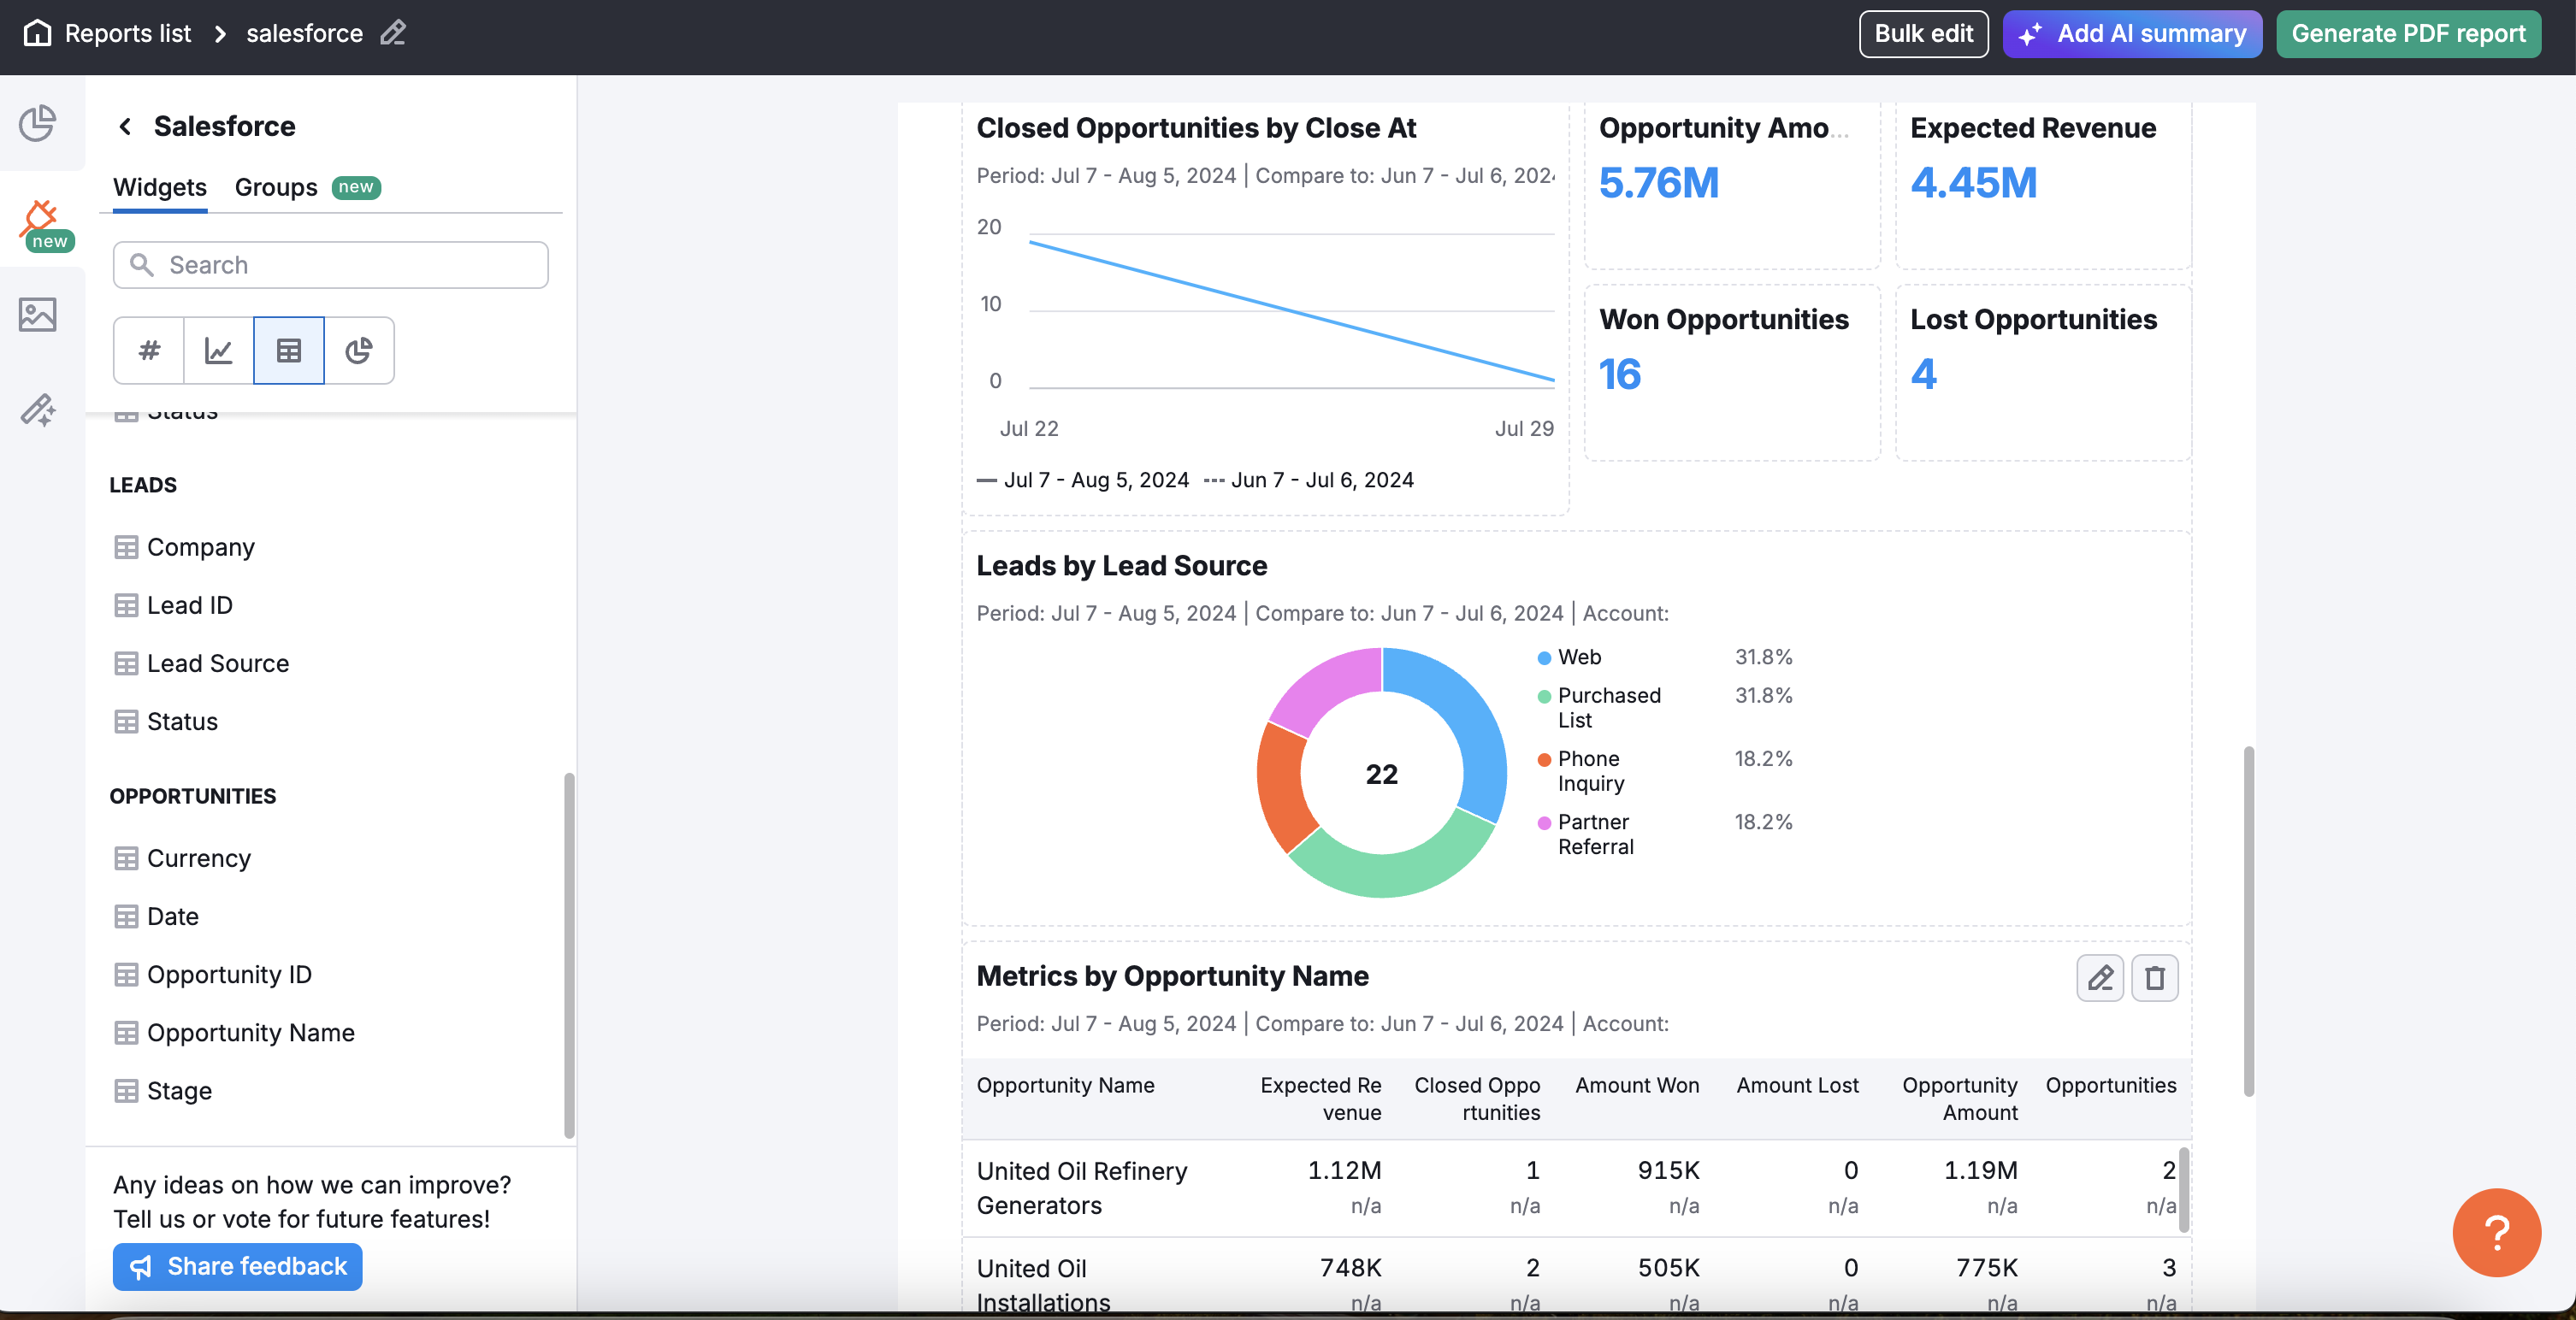
Integrating Salesforce CRM in My Reports allows businesses to monitor sales performance, track customer interactions, and analyze pipeline activity. With insights into lead conversions, deal progress, and revenue trends, brands can gain a clearer understanding of their sales operations and customer relationships.
Single metrics:
ACCOUNTS
- Annual Revenue
- Client Accounts
CONTRACTS
- Contracts
LEADS
- Leads
OPPORTUNITIES
- Amount Lost
- Amount Won
- Closed Opportunities
- Expected Revenue
- Lost Opportunities
- Opportunities
- Opportunity Amount
- Won Opportunities
Metrics in Table:
ACCOUNTS
- Account ID
- Industry
- Rating
- Source
- Status
- Type
- Year Started
CONTRACTS
- Contract Number
- Description
- Status
LEADS
- Company
- Lead ID
- Lead Source
- Status
OPPORTUNITIES
- Currency
- Date
- Opportunity ID
- Opportunity Name
- Stage
Integrating Zoho CRM in My Reports enables businesses to track and analyze customer relationships, sales performance, and lead management in one place. It provides insights into deal progress, conversion rates, and pipeline activity, helping brands monitor sales trends and optimize customer interactions.

Single metrics:
ACCOUNTS
- Accounts
- Annual Revenue
- CALLS
- Calls
CONTACTS
- Contacts
DEALS
- Deals
- Deals Lost
- Deals Won
- Revenue
- Revenue Lost
- Revenue Won
LEADS
- Annual Revenue
- Leads
Metrics in Table:
ACCOUNTS
- Account ID
- Industry
CALLS
- Call ID
- Call Type
- Subject
CONTACTS
- Account ID
- Contact ID
DEALS
- Deal ID
- Stage
LEADS
- Company
- Country
- Industry
- Lead ID
- Lead Source
- Lead Status
When working with integrations, you can rely on a search bar to quickly find a widget with the necessary metrics. You can also filter the widget list by chart type.

Also, Groups are available in the Integrations. With Groups, you can add several widgets with one click, grouped by product task or business area. Widget Groups make the report creation less time-consuming and simplify the flow of creating a report from scratch.
Currently, the Groups are available in the following integrations:
- Google Analytics v4 (AI Traffic Overview, Audience Insights, Key Events, Overview, E-Commerce Overview, Top Traffic Channels, and Top Pageviews)
- Google Search Console (Search Performance Overview, Audience Insights, Desktop Search, and Mobile Search)
- Google Business Profile (Performance Overview, Ratings and Reviews, Impressions Breakdown, and Interactions Breakdown)
- Google Ads (Overview, Campaign Performance, Top Keywords, Audience Insights, and Phone Calls)
- Facebook Pages (Page Overview, Audience Insights, and Posts)
- LinkedIn Company Pages (Follower Highlights, Audience Insights, Organic Post Performance, and Sponsored Post Performance)
- CallRail (Calls Overview and Forms Overview).

Edit Widgets
You can edit any widget in the Integrations. To do so, click the pencil button and change the settings in the right-hand menu.
Any setting, widget titles, and periods can be adjusted.

With the Social Toolkit purchased, you can add data from the following tools: